Sector Heatmap
Overview
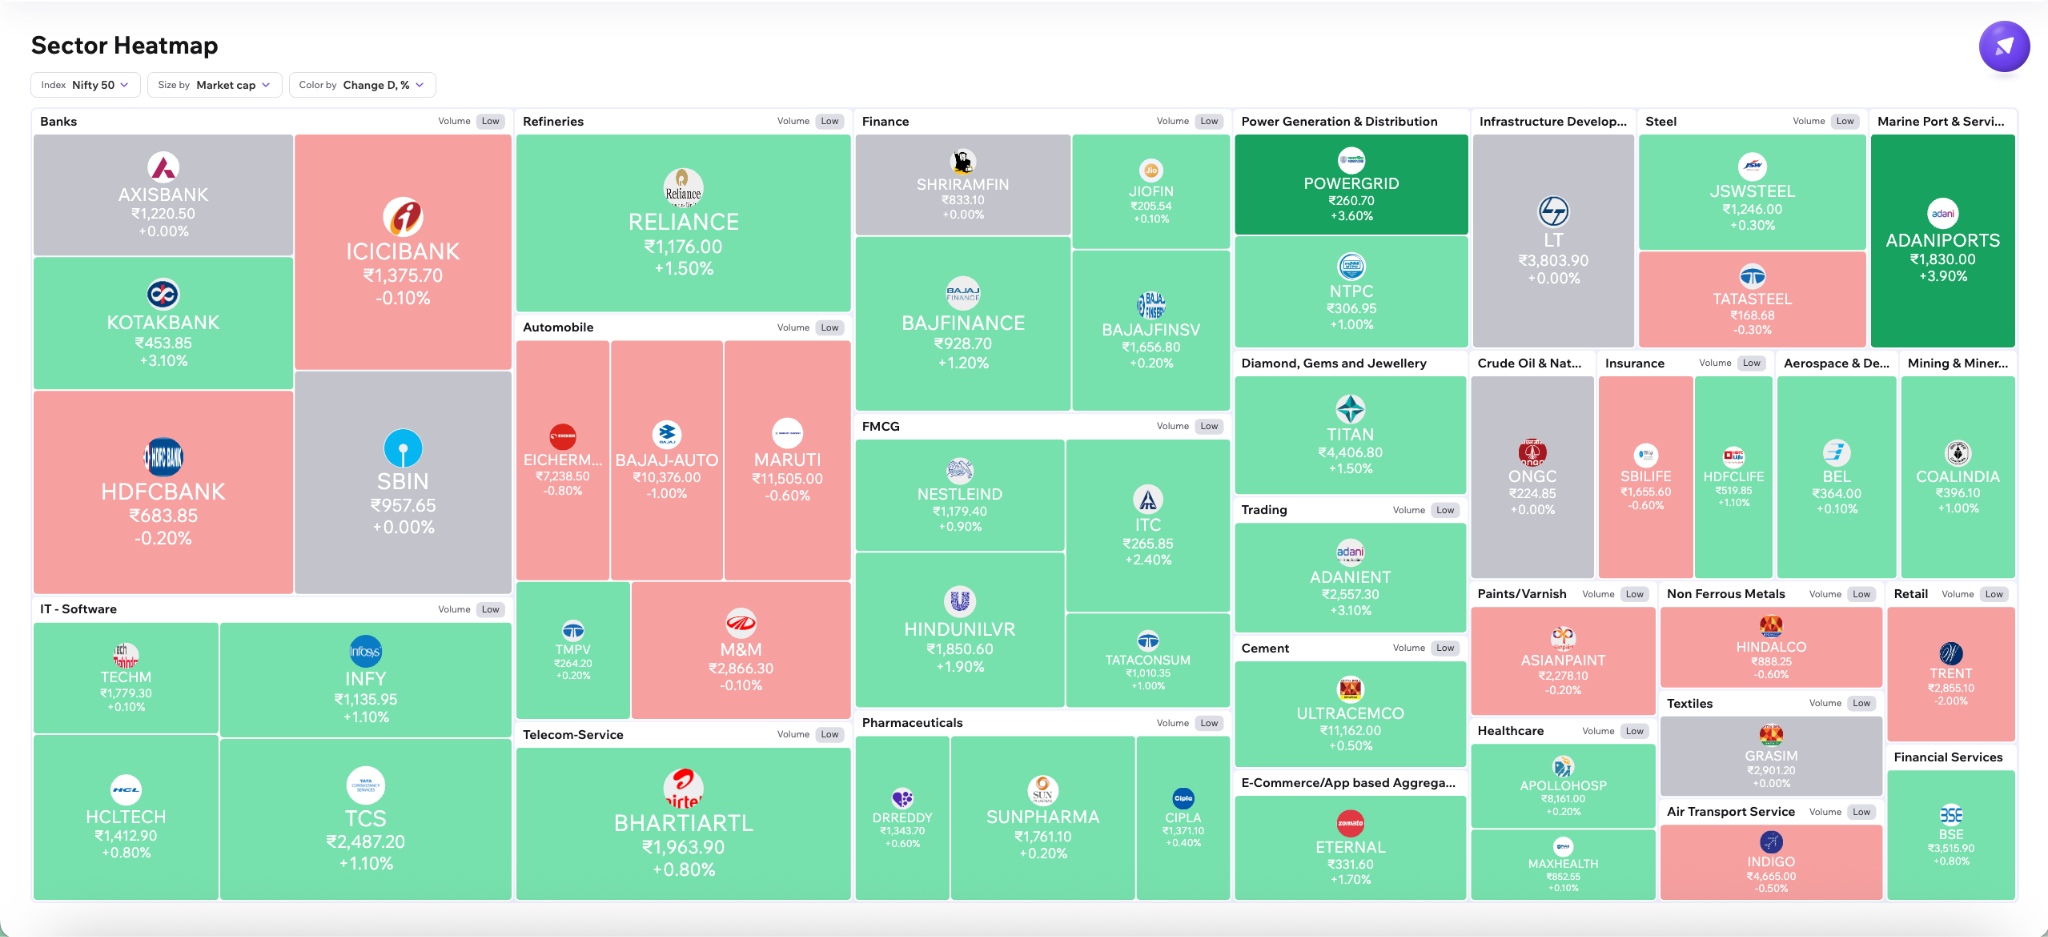
Section titled “Overview”The heatmap provides a visual overview of sectors and their constituent stocks.
- Each large block represents a sector
- Smaller blocks inside represent stocks within that sector
- Larger tiles generally represent larger stocks
- Green indicates positive performance
- Red indicates negative performance
- Darker shades represent stronger movement
This helps traders quickly identify:
- Sector leadership
- Sector weakness
- Market rotation
- Stronger and weaker stocks within sectors
Size By, Color By & Rank By
Section titled “Size By, Color By & Rank By”The dashboard includes multiple controls that allow traders to analyze sectors from different perspectives.
Size By
Section titled “Size By”Changes stock tile size using metrics such as:
- Market Cap
- Volume
- Turnover
- Equal-weight sizing
Equal-weight mode gives all stocks the same tile size, helping traders focus purely on participation and performance rather than market-cap influence.
Color By
Section titled “Color By”Changes what the heatmap colors represent.
Examples include:
- Intraday performance
- Multi-period performance
- Relative volume
- Volatility
- Pre-market change
- Post-market change
An interactive color legend helps traders interpret movement intensity more easily.
Rank By
Section titled “Rank By”Changes how sectors and stock tiles are positioned within the dashboard.
Sectors can be ranked using metrics such as:
- Volume activity
- Technical indicators
- Performance
- Participation metrics
This helps surface stronger sectors faster.
Volume Activity
Section titled “Volume Activity”Each sector is tagged based on trading activity relative to historical participation.
Sectors may display:
- High volume
- Moderate volume
- Low volume
Higher volume activity can indicate:
- Stronger conviction
- Increased participation
- Higher institutional activity
This adds additional context beyond simple price movement.
Sector Drilldown
Section titled “Sector Drilldown”Drilldown View
Section titled “Drilldown View”Clicking on a sector zooms into a sector-only heatmap containing its constituent stocks.
The drilldown view maintains the same controls such as:
- Size By
- Color By
- Rank By
- Timeframe filters
Additional sector-level context is also displayed at the top, including:
- Breadth
- Volume activity
This helps traders quickly identify:
- Leading stocks within strong sectors
- Weak stocks inside strong sectors
- Relative participation
- Internal leadership
Equal Tile View
Section titled “Equal Tile View”The dashboard also supports an equal-size tile layout where all stocks appear with identical sizing.
This removes market-cap influence and helps traders focus more on:
- Relative performance
- Participation
- Momentum
This is especially useful for identifying:
- Smaller outperformers
- Hidden sector strength
- Broad participation trends
Hover Insights
Section titled “Hover Insights”Hovering over a stock displays additional contextual information such as:
- Price
- % change
- Market cap
This provides faster insight without needing to open individual company pages.