Chart Patterns in Screener
Chart Patterns in the Screener help you identify stocks whose price action matches a particular chart pattern.
Unlike numeric screening conditions, such as RSI below 30 or volume greater than twice its average, a chart pattern condition checks whether a selected pattern exists in a stock’s latest price action.
Tradomate lets you select a recognised chart pattern, draw your own pattern, or describe the pattern you want to find using Tradomate AI. You can combine chart pattern conditions with other screening conditions to narrow down stocks that match your requirements.
How to Add Chart Patterns
Section titled “How to Add Chart Patterns”There are three ways to add chart patterns to your screen.
Draw or Select a Chart Pattern
Section titled “Draw or Select a Chart Pattern”Click Draw chart pattern in the custom Screener workspace to open the pattern selection dialog.
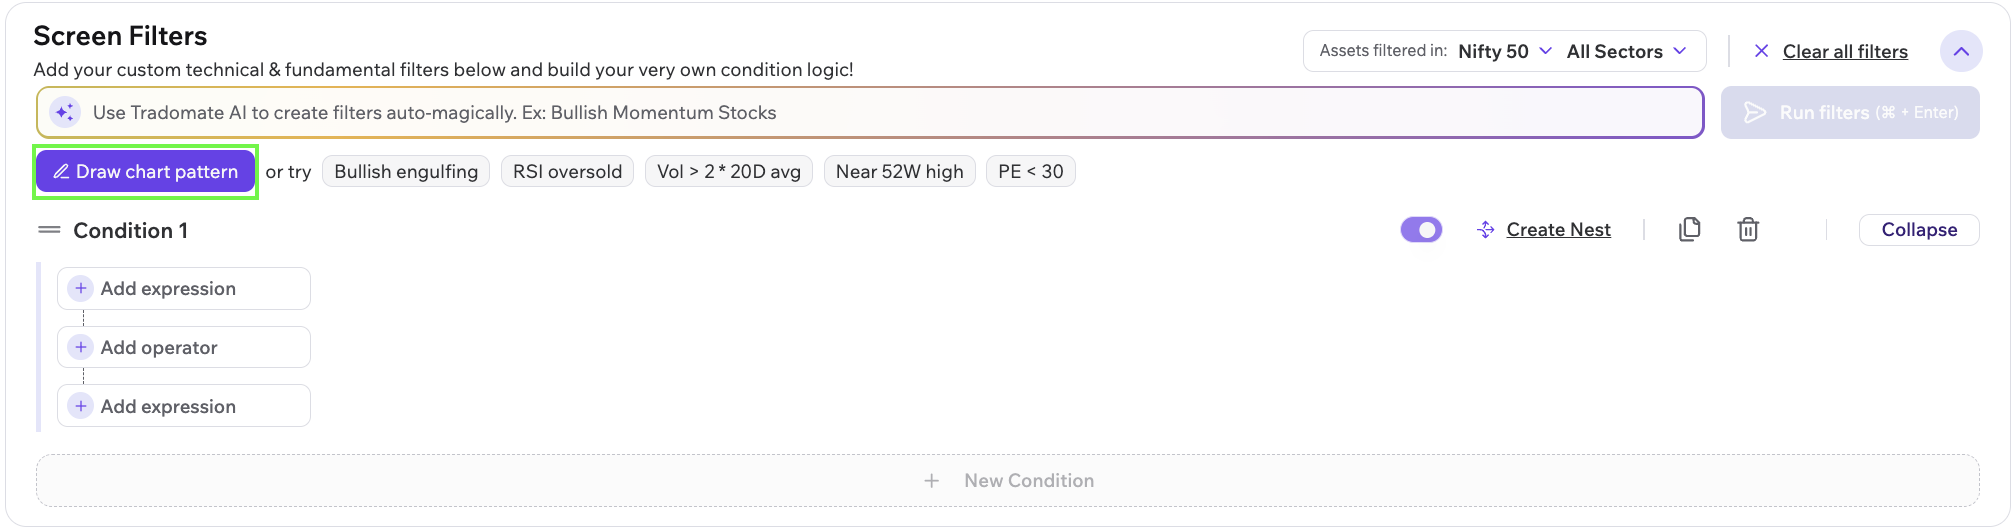
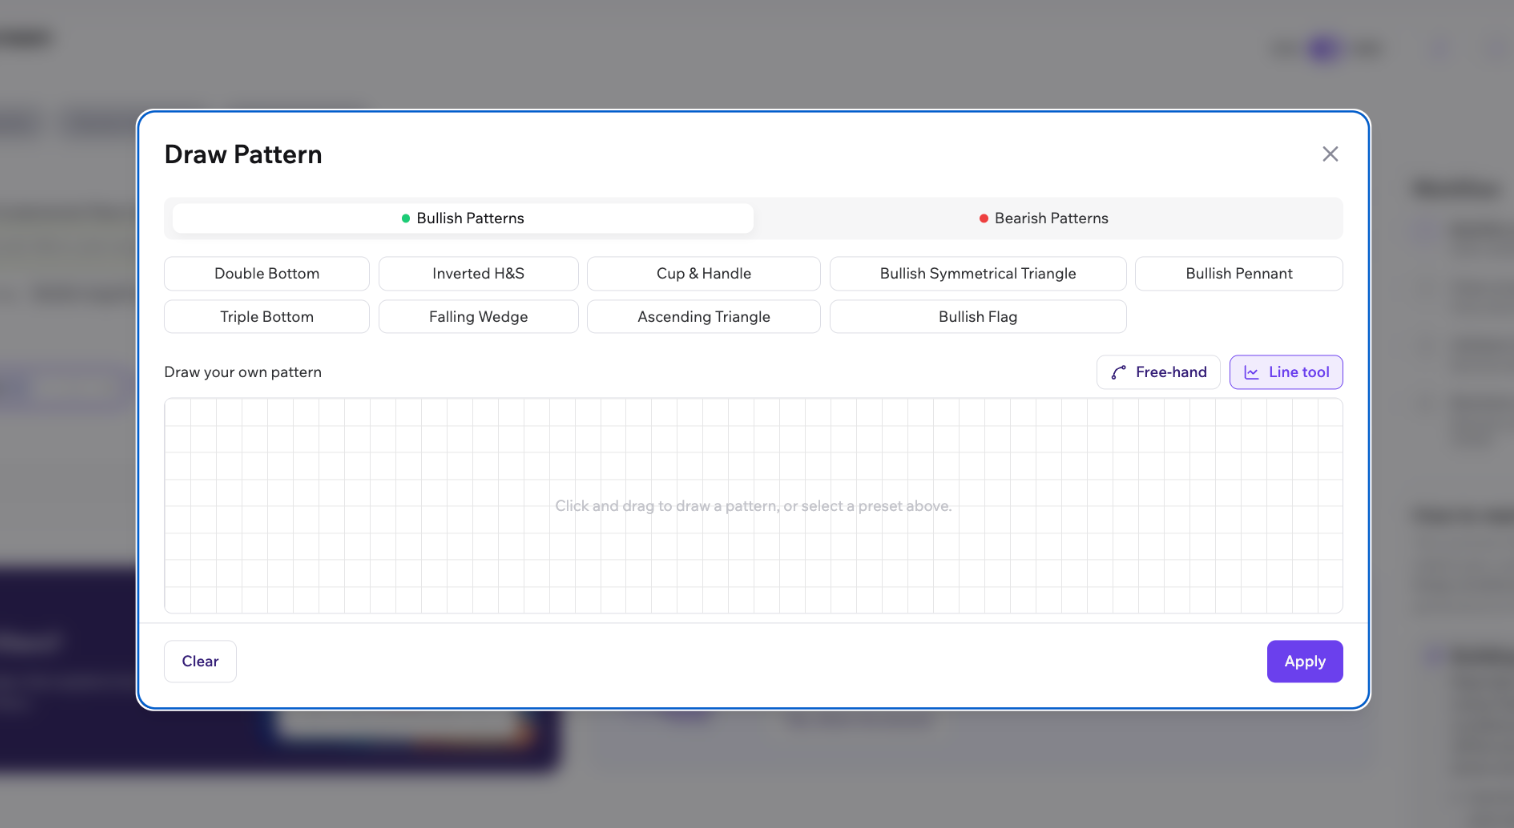
You can choose from the available predefined patterns or draw your own pattern using the drawing tools.
The dialog provides two drawing methods:
- Free-hand: Draw the shape of a pattern by hand.
- Line tool: Create a pattern using connected lines.
You can also select a recognised pattern from the available presets, organised into Bullish Patterns and Bearish Patterns.
After selecting or drawing a pattern, click Apply to add it to your screening workflow.
Add a Pattern Through the Expression Menu
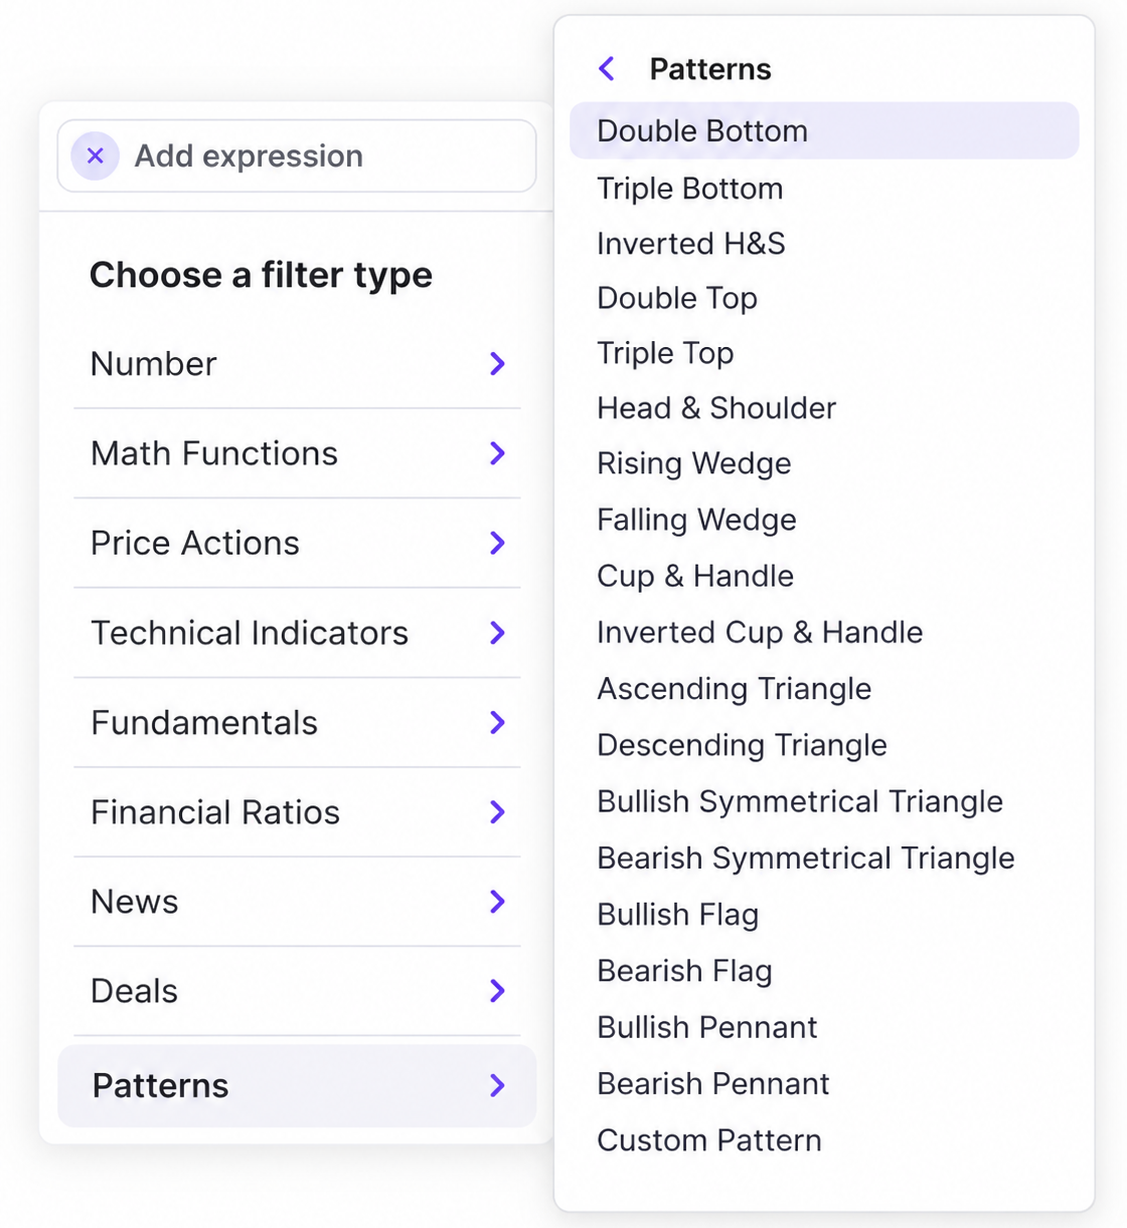
Section titled “Add a Pattern Through the Expression Menu”You can also add a chart pattern directly as a screening condition.
- Click Add expression in the custom Screener workspace.
- Select Patterns from the available filter categories.
- Choose the chart pattern you want to screen for.
When you select Patterns, the menu lists 18 predefined chart patterns: Double Bottom, Triple Bottom, Inverted H&S, Double Top, Triple Top, Head & Shoulder, Rising Wedge, Falling Wedge, Cup & Handle, Inverted Cup & Handle, Ascending Triangle, Descending Triangle, Bullish Symmetrical Triangle, Bearish Symmetrical Triangle, Bullish Flag, Bearish Flag, Bullish Pennant, and Bearish Pennant. It also includes a Custom Pattern option for drawing your own pattern.
This allows you to add chart patterns alongside other technical indicators, price-action conditions, and fundamental filters.
Describe a Pattern Using Tradomate AI
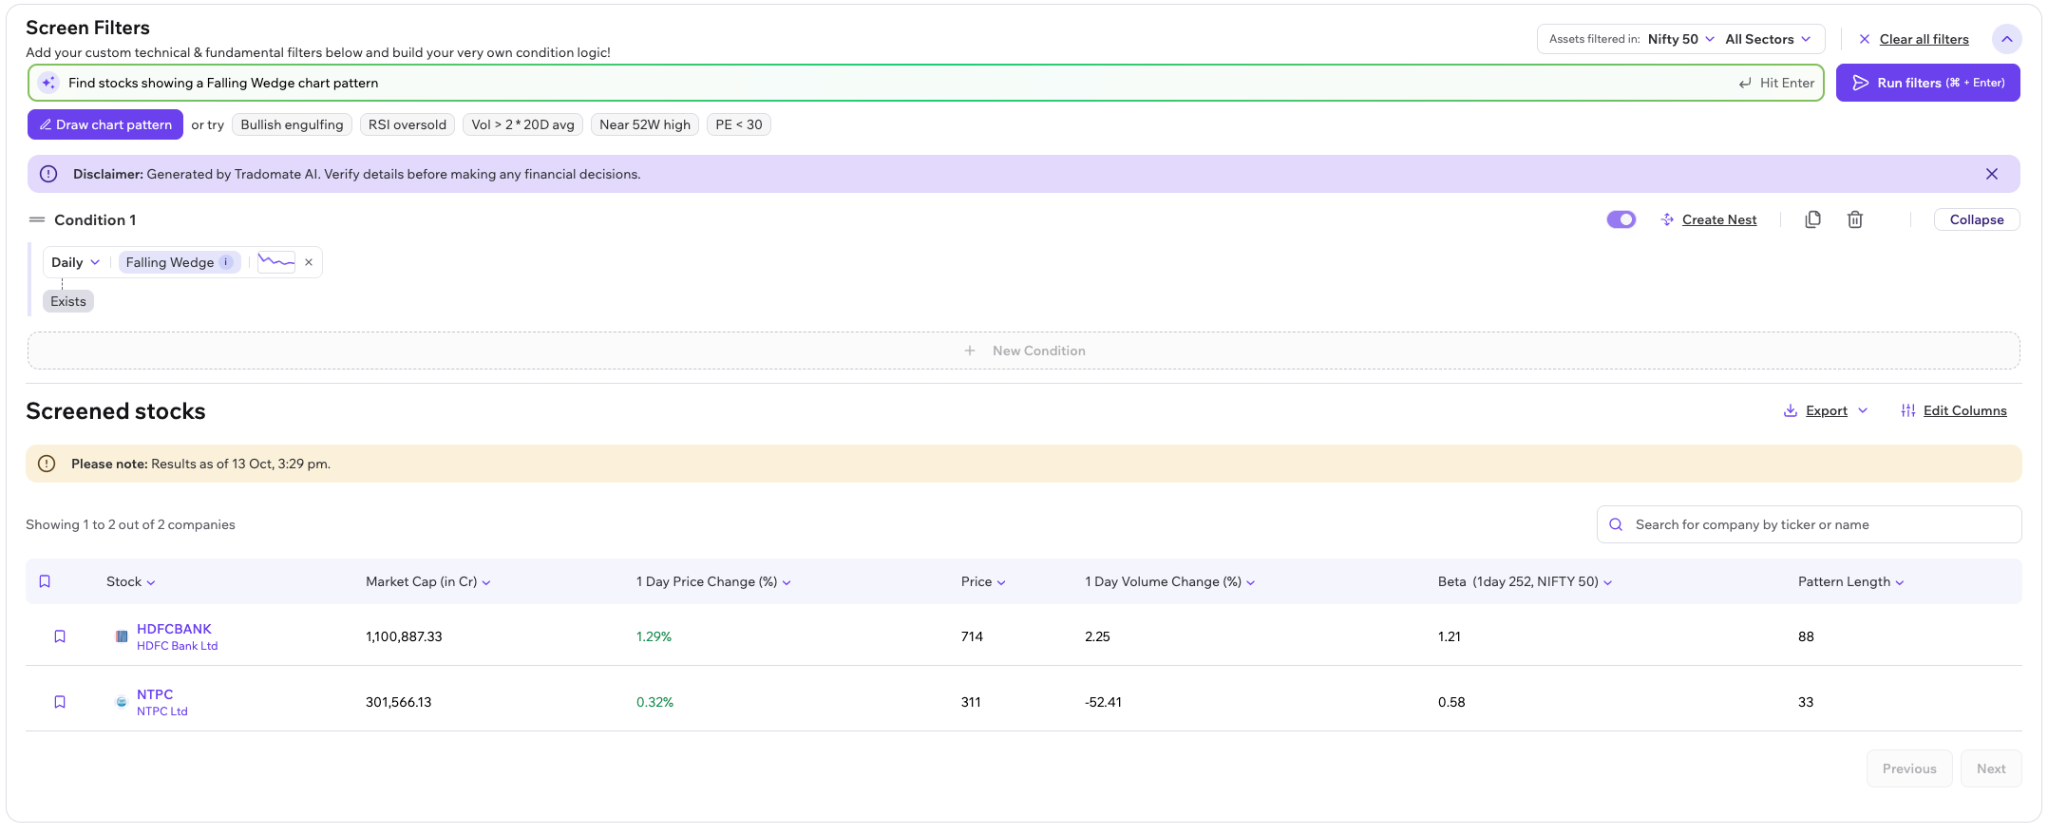
Section titled “Describe a Pattern Using Tradomate AI”You can describe the stocks you want to find in the AI input bar instead of configuring the condition manually.
For example, you could simply enter:
- Find stocks showing a Double Bottom pattern
- Show me stocks with a Falling Wedge
- Stocks showing a Bullish Flag pattern
Tradomate AI can use your description to help create the corresponding screening conditions.
Edit an Existing Pattern Condition
Section titled “Edit an Existing Pattern Condition”You can also edit a chart pattern condition that you’ve already added to your screen. Click the pattern’s drawing icon in the condition to reopen the Draw Pattern dialog, where you can modify the existing pattern or select a different one.
How Chart Patterns Appear on the Chart
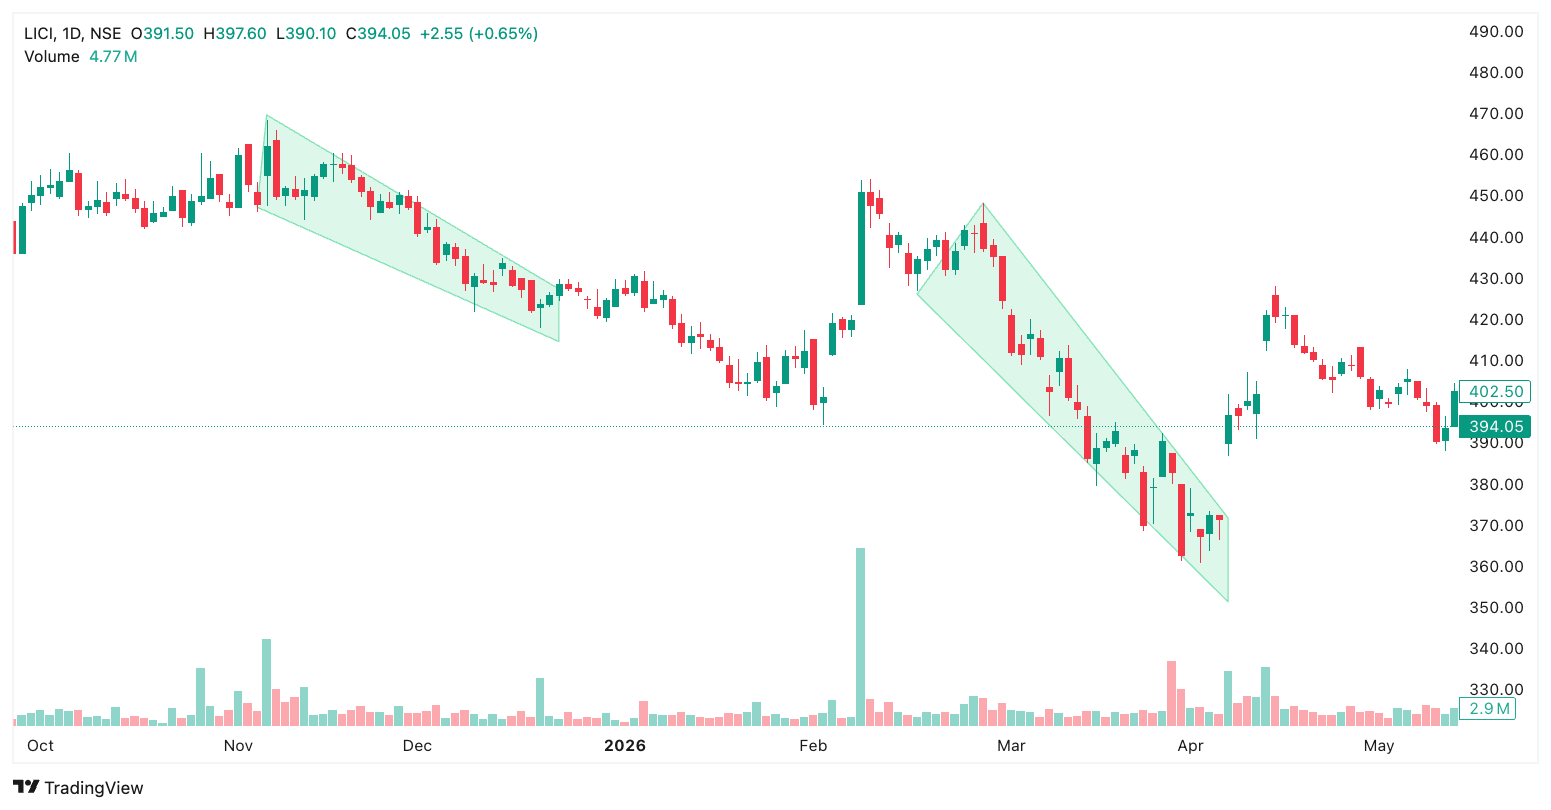
Section titled “How Chart Patterns Appear on the Chart”When a chart pattern is identified, it can be marked on the stock’s price chart to help you visualise the price structure associated with the pattern.
For example, a Falling Wedge can be represented by two downward-sloping boundaries that narrow towards each other as the price moves within the formation.
Visualising the pattern helps you relate the screening condition to the stock’s actual price action.
Simple Example
Section titled “Simple Example”Suppose you want to identify stocks showing a Double Bottom pattern.
You can add the Double Bottom condition through the Draw chart pattern dialog, the expression menu, or Tradomate AI.
Run your screen to find stocks matching the selected condition. You can then review the resulting stocks and examine their charts to understand the price structure.
You can also combine the pattern condition with other filters, such as technical indicators or fundamental parameters, to narrow your results further.
What to Keep in Mind
Section titled “What to Keep in Mind”- A chart pattern condition checks for the presence of a selected pattern; it is not simply a numeric threshold.
- Different patterns represent different price structures and potential market scenarios.
- A detected pattern does not guarantee a breakout, reversal, or any particular price movement.
- Review the stock’s chart and other relevant information before making a trading decision.