Sector Fundamentals
Overview
Section titled “Overview”This page compares sectors and stocks using financial and valuation metrics.
Examples include:
Valuation Ratios
Section titled “Valuation Ratios”- PE
- PB
- EV/EBITDA
- Price to Sales
Profitability Ratios
Section titled “Profitability Ratios”- ROE
- ROCE
- EBITDA Margin
- Net Profit Margin
Growth Ratios
Section titled “Growth Ratios”- Revenue Growth
- Profit Growth
- CAGR metrics
Leverage & Risk Ratios
Section titled “Leverage & Risk Ratios”- Debt to Equity
- Interest Coverage Ratio
Market Metrics
Section titled “Market Metrics”- Returns
- Relative Volume
- Volatility
Sector-Level Comparison
Section titled “Sector-Level Comparison”Sector ratios are calculated using sector-level aggregation logic such as:
- Market-cap weighted averages
- Aggregated financial calculations
- Growth aggregation methods
This allows traders to compare sectors more meaningfully instead of relying only on individual stock data.
Sector Ratio Table
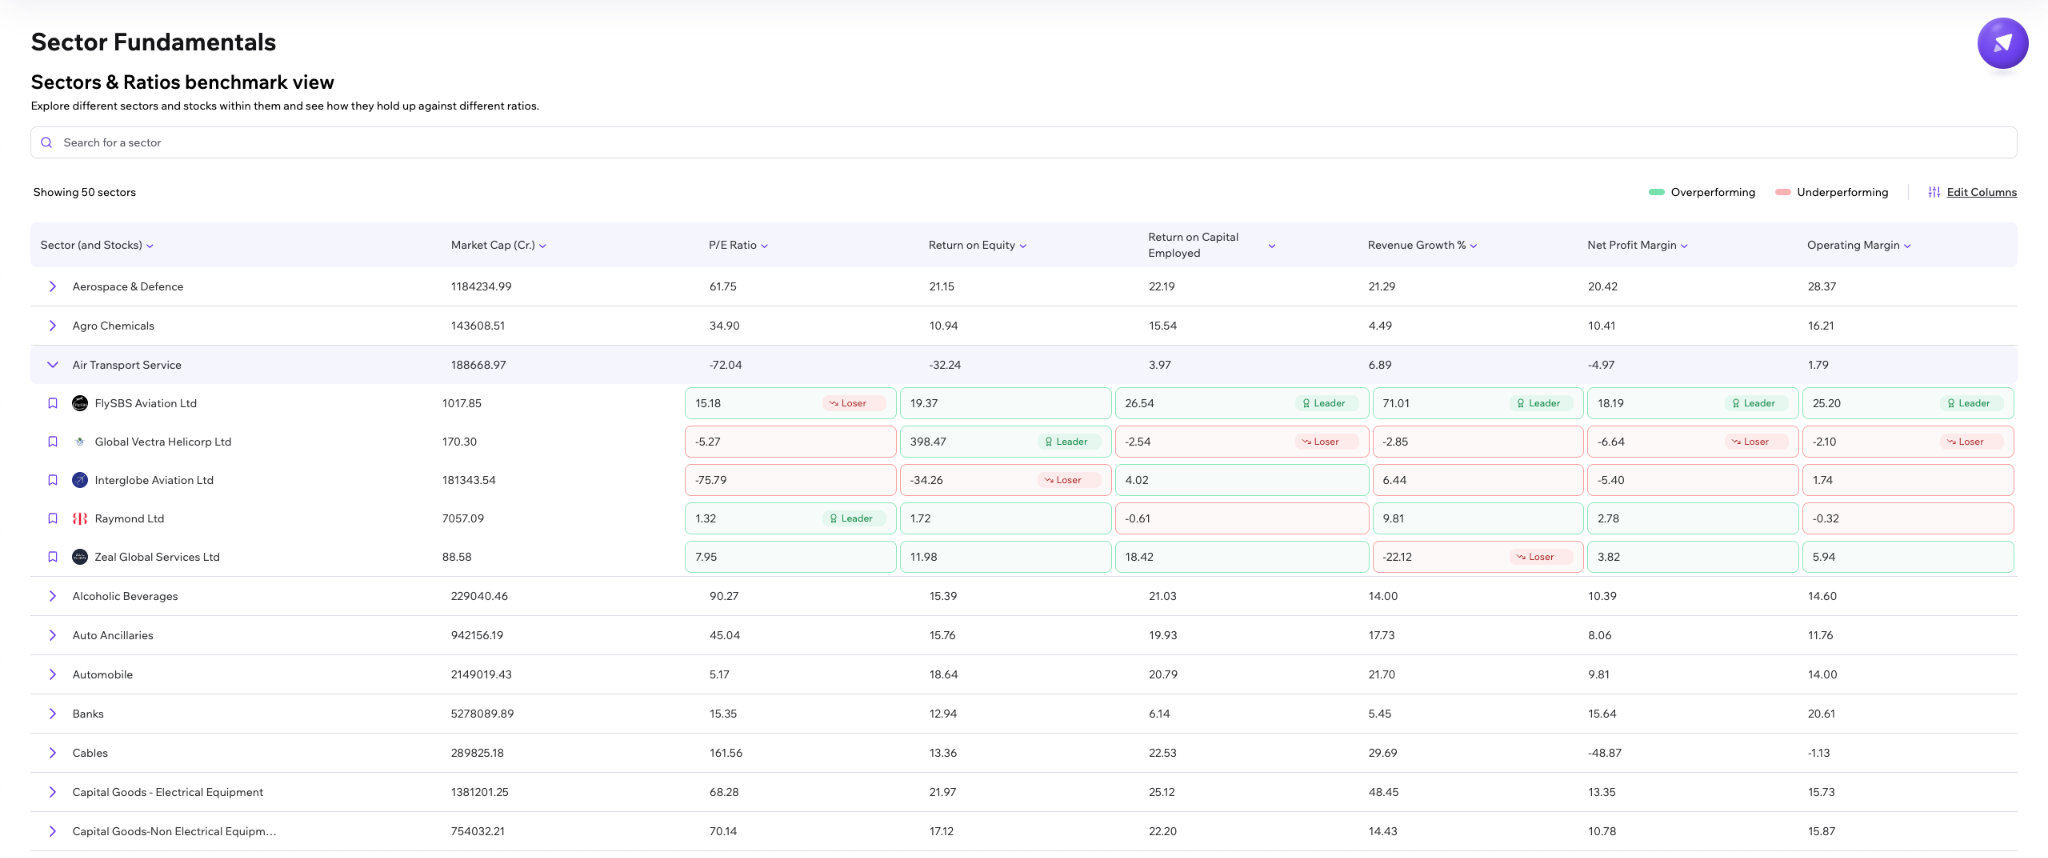
Section titled “Sector Ratio Table”The default ratios table compares sectors across multiple metrics in a clean table layout.
Users can:
- Sort by any column
- Change stock universes
- Expand sectors inline
- Compare stocks against sector averages
This helps traders quickly identify:
- Stronger sectors
- More profitable sectors
- Faster-growing sectors
- Expensive vs cheaper sectors
Sector Drilldown Accordion
Section titled “Sector Drilldown Accordion”Clicking on a sector row expands an inline accordion showing constituent stocks and their respective ratios.
The stock-level table helps traders compare:
- Stocks vs sector averages
- Stocks vs peers
- Relative valuation
- Relative profitability
- Relative growth
Highlighting Logic
Section titled “Highlighting Logic”The dashboard uses contextual highlighting to simplify comparison.
Valuation Ratios
Section titled “Valuation Ratios”For ratios like:
- PE
- PB
Lower than sector averages are generally highlighted green (relatively cheaper), while higher values are highlighted red (relatively expensive).
Profitability & Growth Ratios
Section titled “Profitability & Growth Ratios”For ratios like:
- ROE
- ROCE
- EBITDA Margin
- Revenue Growth
Higher values are generally highlighted green (stronger), while lower values are highlighted red (weaker).
Leverage Ratios
Section titled “Leverage Ratios”For leverage metrics:
- Lower leverage may be highlighted green
- Higher leverage may be highlighted red
This helps traders interpret sector-relative positioning more quickly.
Edit Columns
Section titled “Edit Columns”The Ratios section also supports customizable columns through the Edit Columns feature.
Users can:
- Add/remove ratios
- Reorder columns
- Customize sector comparison views
Selected ratios dynamically update both:
- Sector-level tables
- Stock-level accordion views
This allows deeper and more personalized sector analysis.
What This Helps You Do
Section titled “What This Helps You Do”The Sectors Dashboard helps traders:
- Track where capital is flowing
- Understand sector participation
- Spot broad-based strength
- Identify weak sectors quickly
- Discover stronger stocks within leading sectors
- Compare companies against peers and sector averages
- Move from sector analysis into stock selection faster
Instead of relying only on index movement or isolated stock charts, the dashboard provides a more structured top-down analysis framework for market participants.