Support and Resistance on Company Page
Support and Resistance levels can be viewed directly on the chart of any stock on Tradomate.
Steps to access:
Section titled “Steps to access:”- Go to any Company Page
- Navigate to the Chart section (Performance Overview)
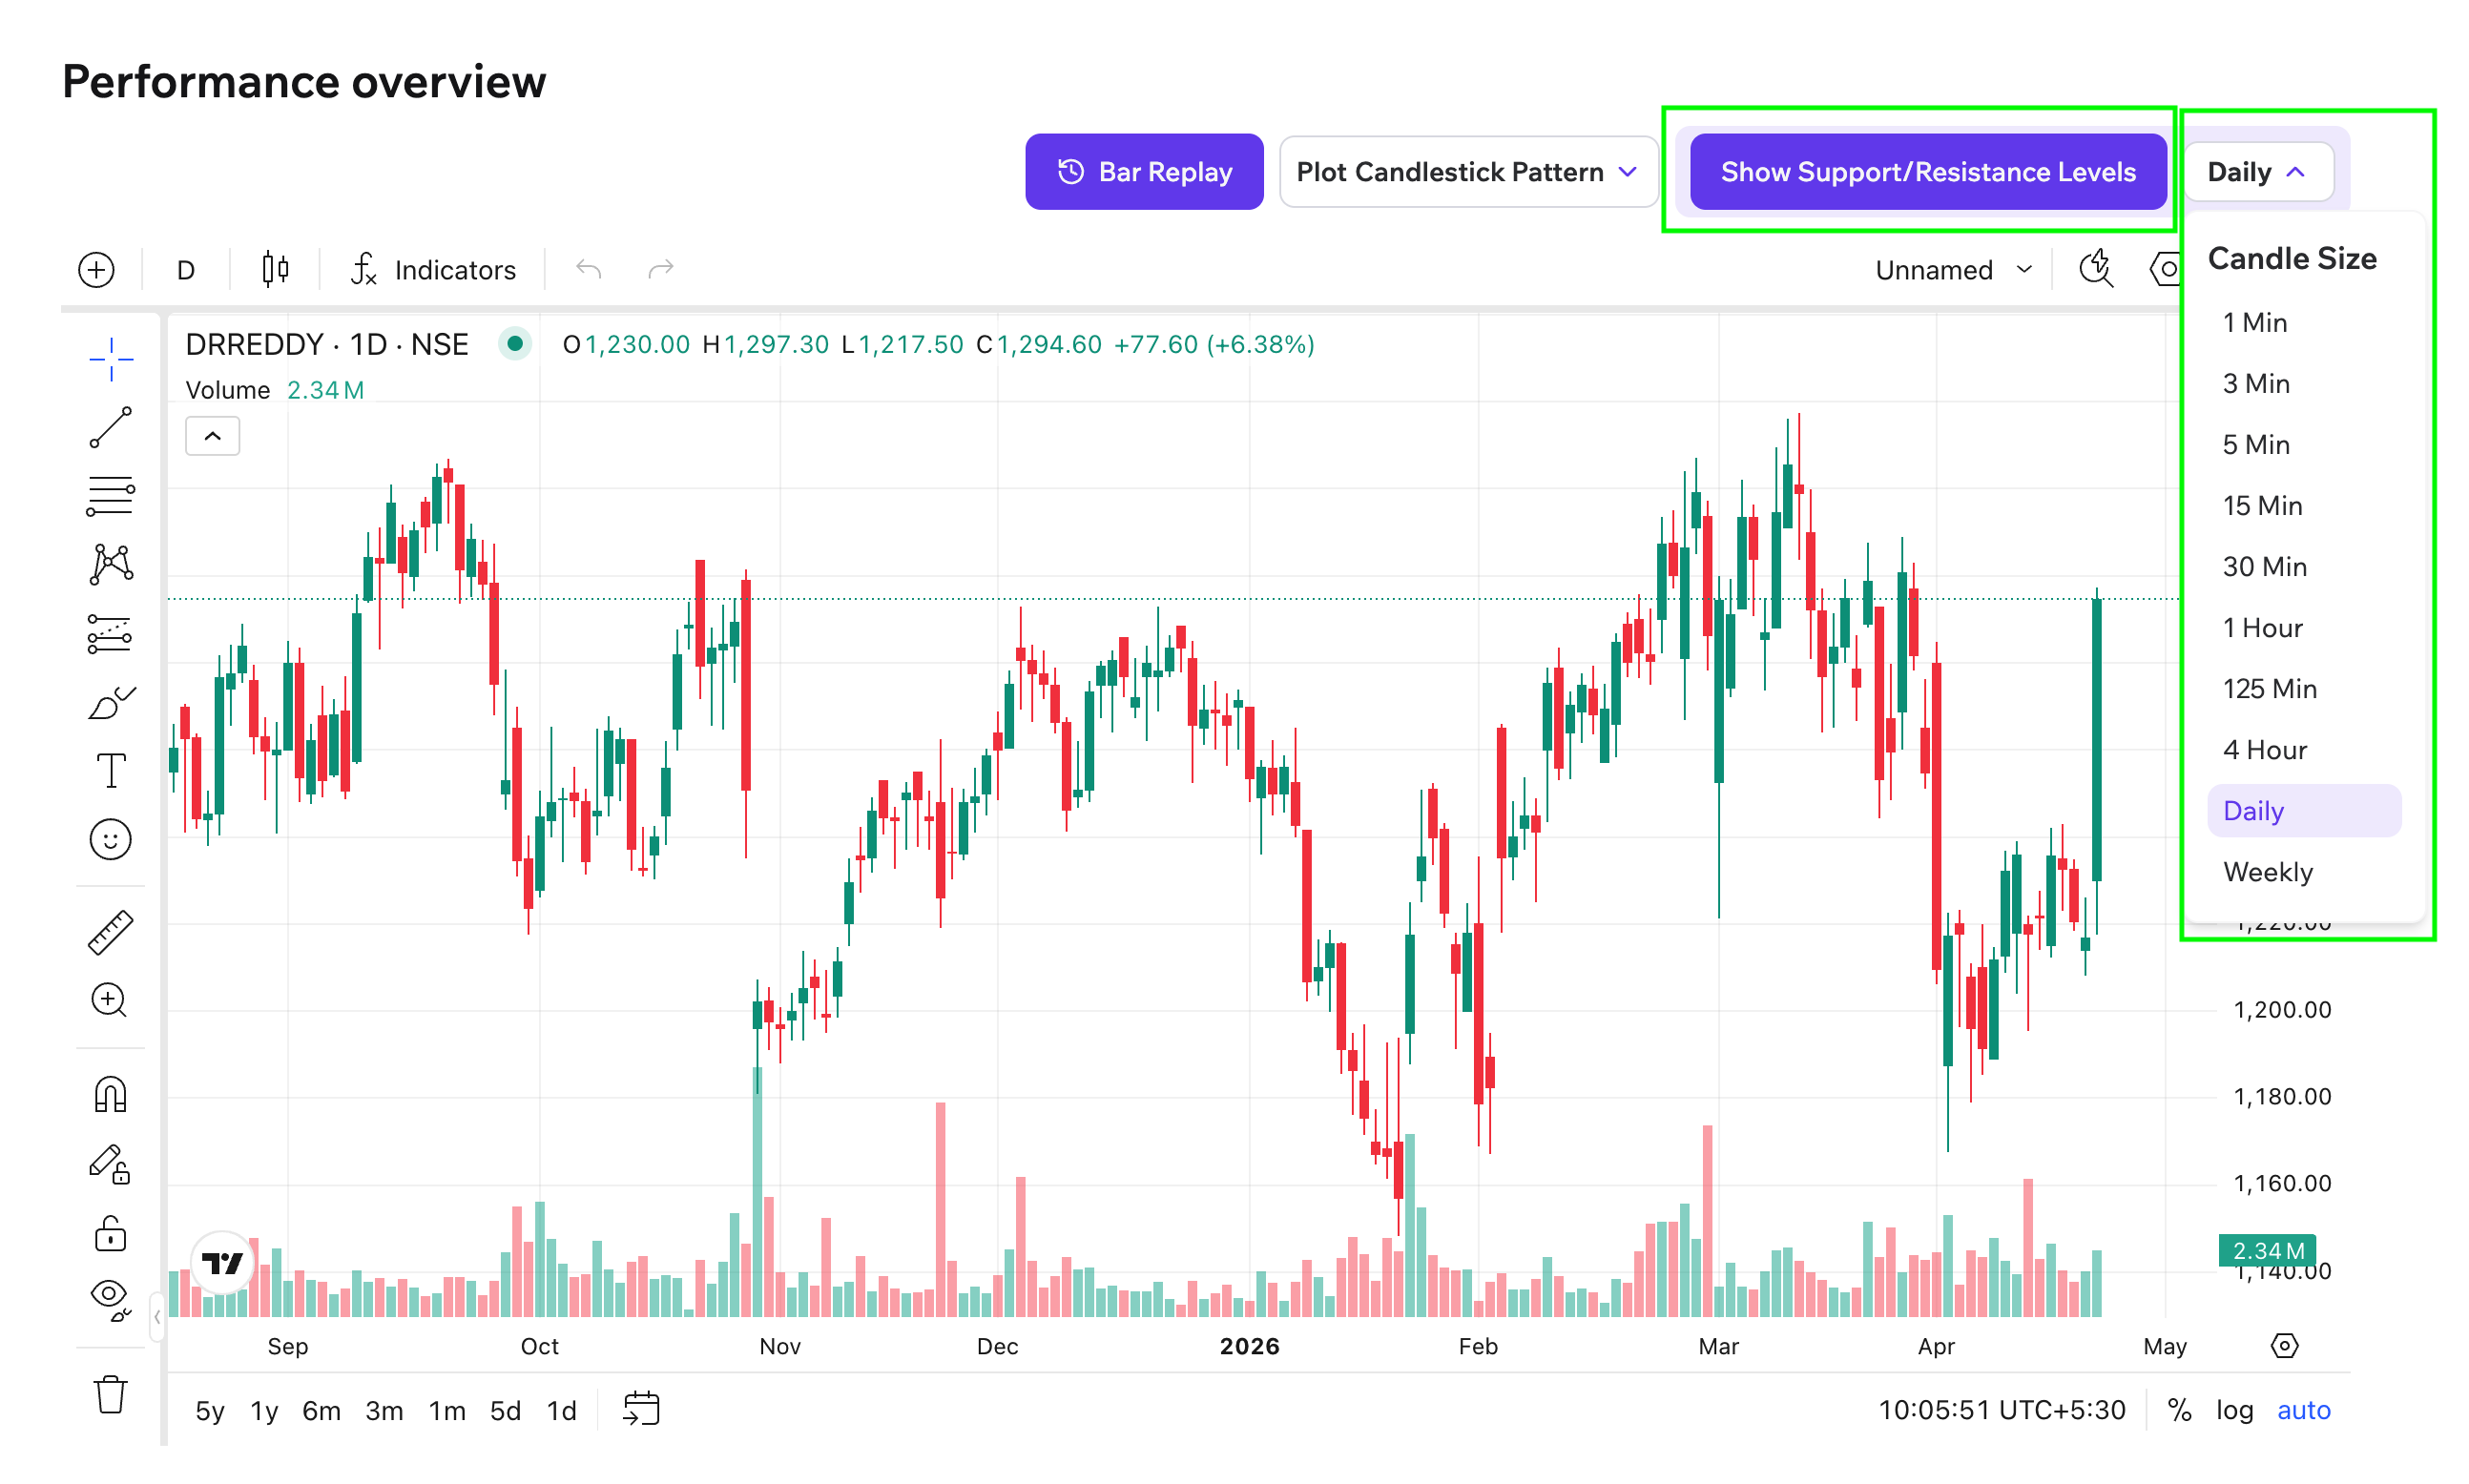
- Click on “Show Support/Resistance Levels”
- Select your preferred timeframe (1 Min, 1 Hour, Daily, etc.)
What you’ll see on the chart:
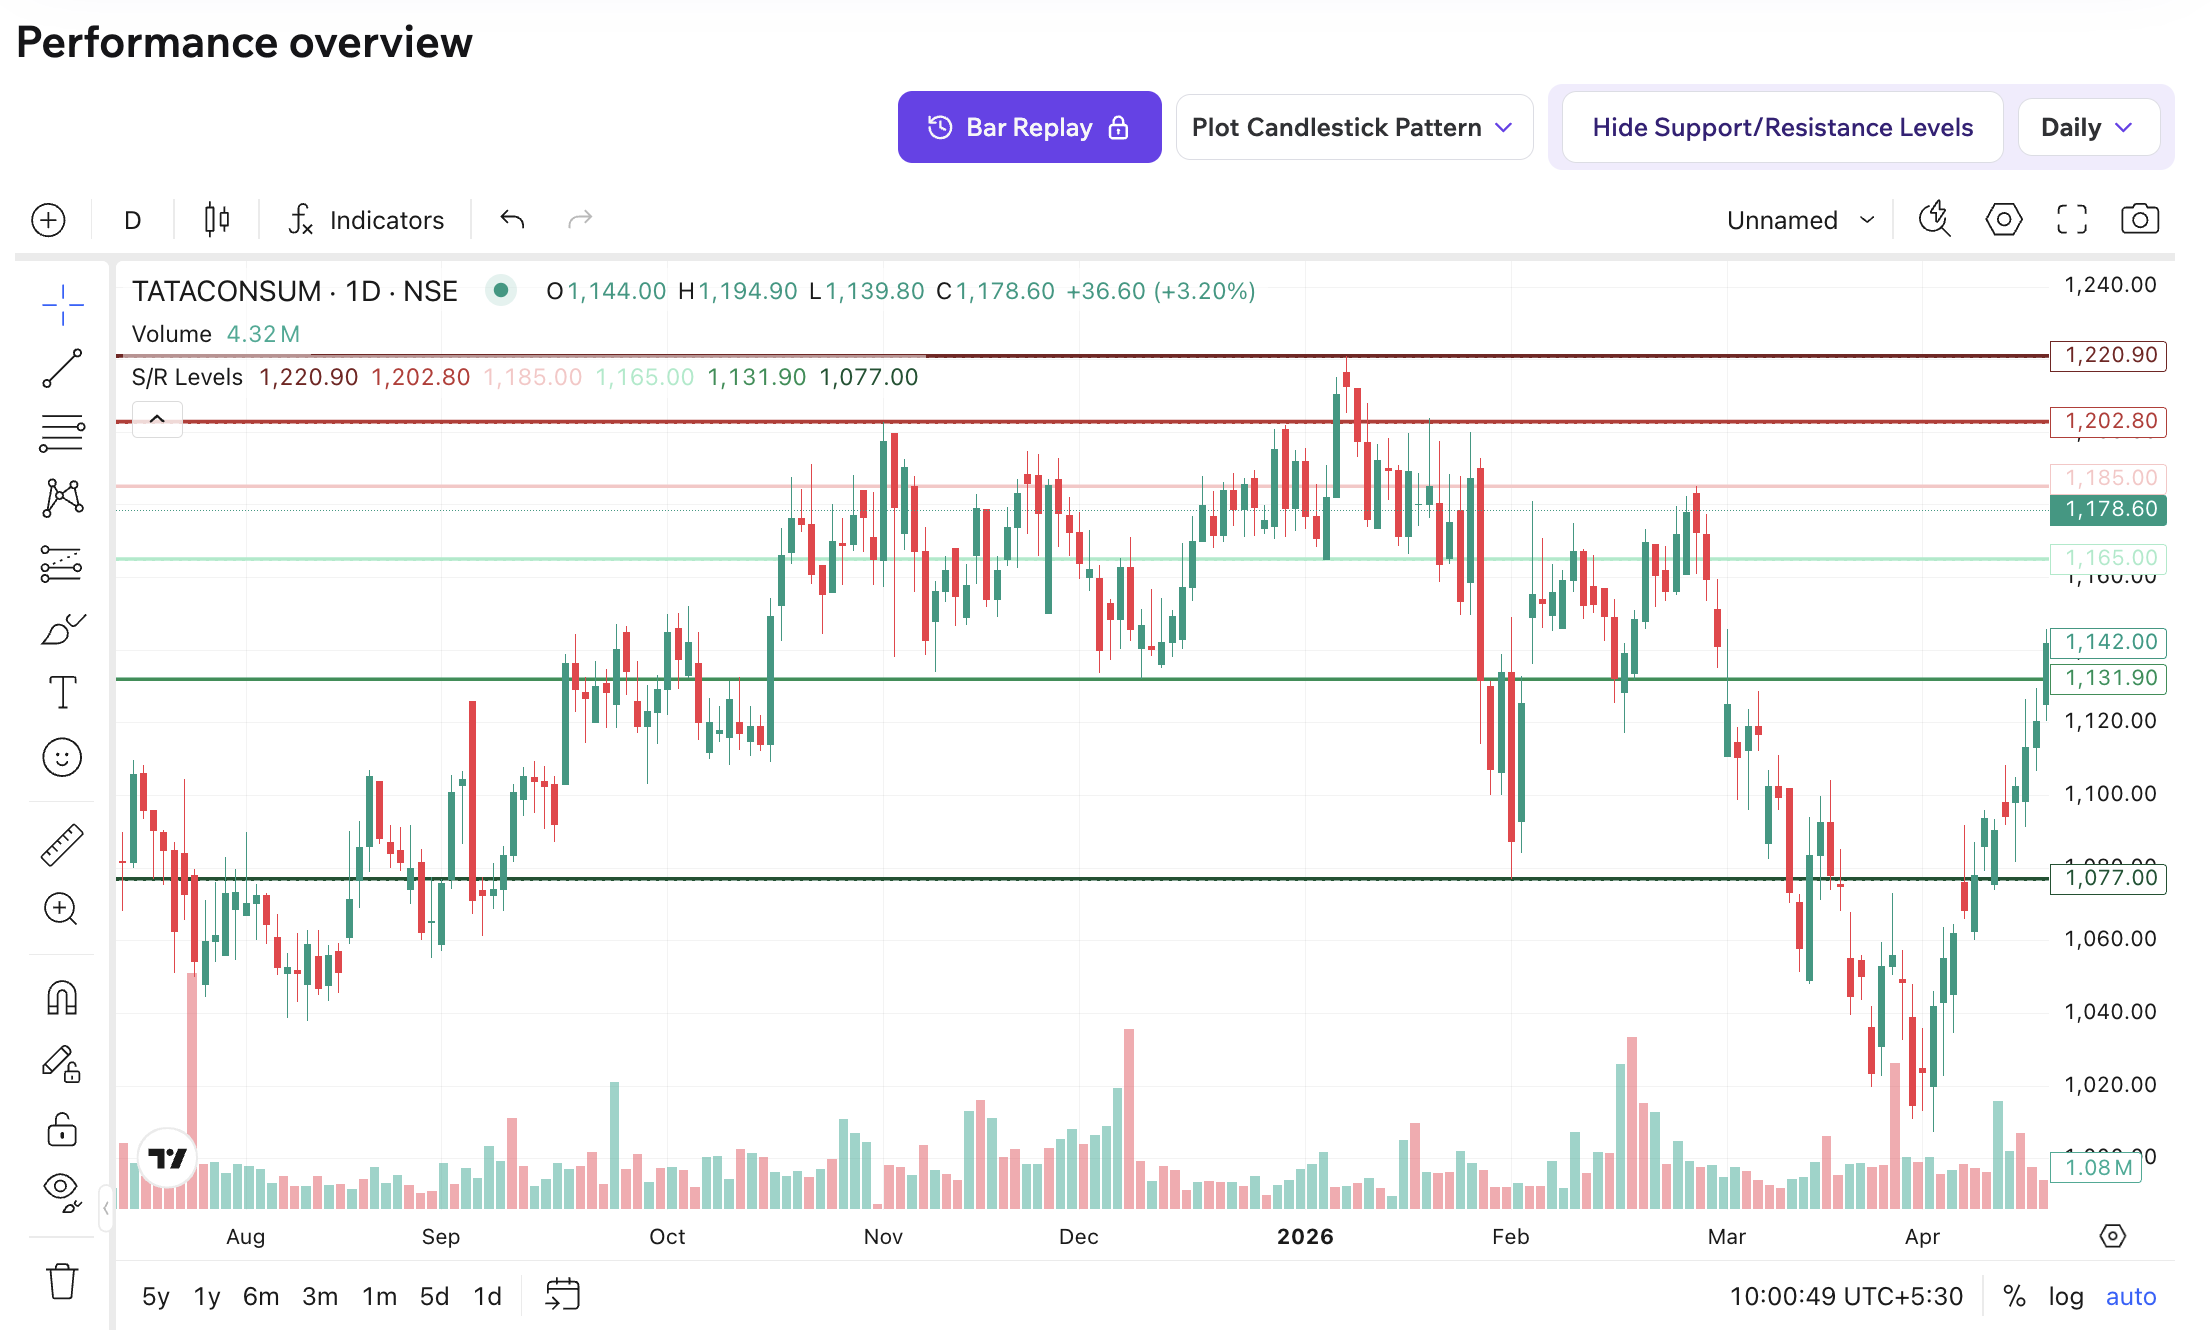
Section titled “What you’ll see on the chart:”- Horizontal lines marking key price levels
- Red lines indicate resistance zones (R1, R2, R3)
- Green lines indicate support zones (S1, S2, S3)
- The nearest levels relative to current price are highlighted for quick reference
How it works:
Section titled “How it works:”- Levels are automatically calculated using pivot points
- They update dynamically based on recent price action
- This ensures levels stay relevant to current market structure