Seasonality Analysis
Seasonality Analysis in Tradomate helps traders identify recurring historical patterns in stocks and indices.
Instead of looking only at how a stock is performing today, Seasonality looks at how it has historically behaved during:
- A particular month of the year
- A specific entry date
- Different holding periods
- Repeated periods across multiple years
The goal is to help traders identify whether certain periods have historically shown consistent positive or negative behaviour.
Seasonality Analysis can be explored through three primary views:
- Stock Performance
- Historical Swing Screener
- Monthly Returns Heatmap
Each view approaches seasonality differently, helping traders move from broad patterns to deeper historical analysis.
1. Stock Performance
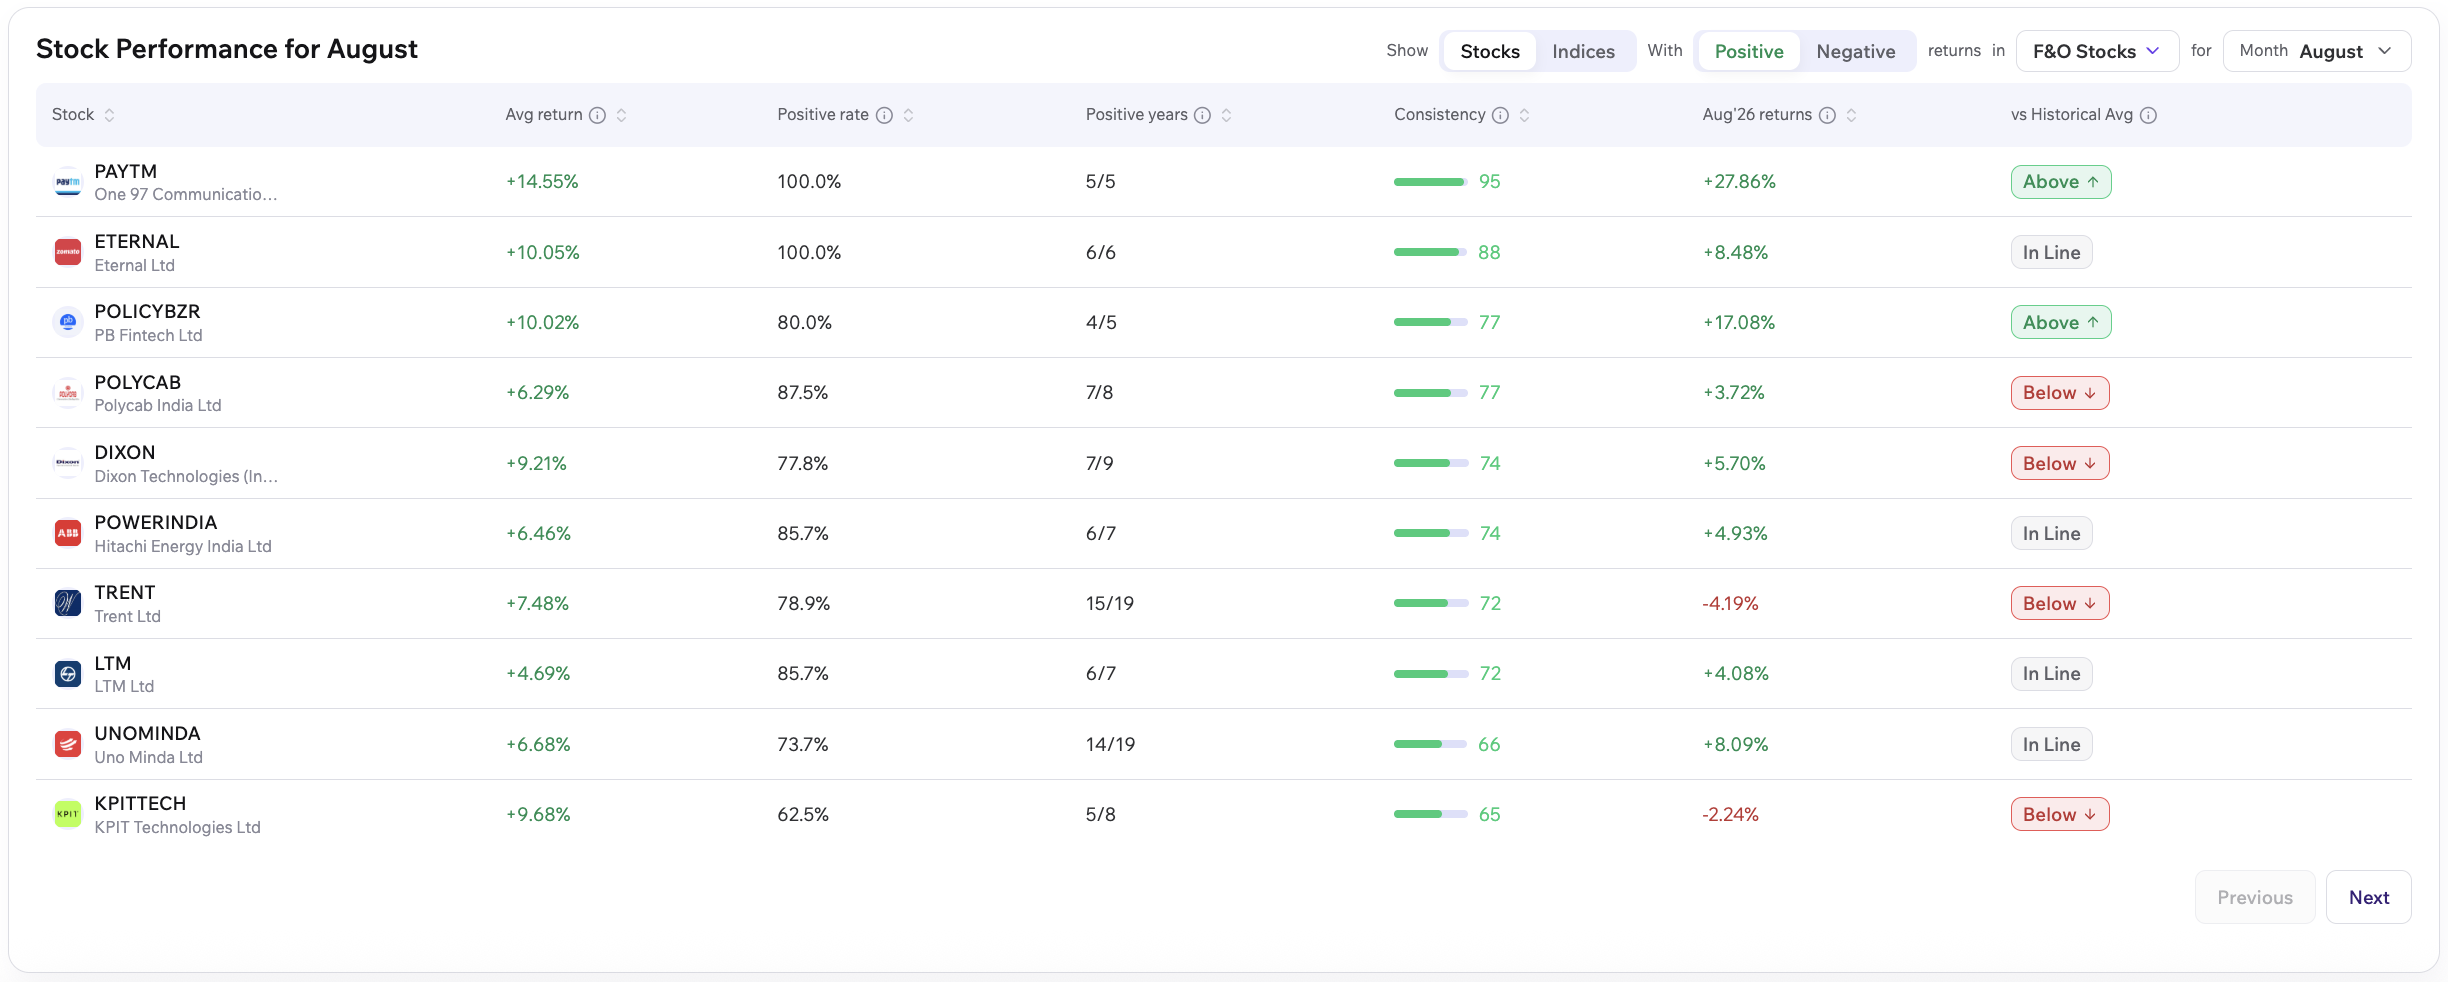
Section titled “1. Stock Performance”The Stock Performance view helps traders identify stocks that have historically performed well or poorly during a selected month.
For example:
Which stocks have historically performed positively in August?
The results table ranks stocks based on their historical performance during the selected period.
Available Controls
Section titled “Available Controls”Traders can filter the results using:
- Stocks / Indices: Switch between stock and index seasonality.
- Positive / Negative Returns: Focus on historically positive or negative behaviour.
- Stock Universe: Select the market universe to analyse like Nifty 50, Nifty 500, etc.
- Month: Select the month whose historical performance should be analysed.
Understanding the Results
Section titled “Understanding the Results”Average Return
Section titled “Average Return”The average return generated by the stock during the selected month across its available historical data.
Positive Rate
Section titled “Positive Rate”The percentage of historical occurrences where the stock generated a positive return during the selected month.
For example, a positive rate of 72% means the stock closed positively in approximately 72% of historical observations.
Positive Years
Section titled “Positive Years”Shows the number of years in which the stock generated a positive return compared with the total number of years analysed. This helps derive the Positive Rate mentioned above.
For example:
13/18 means the stock delivered positive returns in 13 out of 18 historical observations.
Consistency Score
Section titled “Consistency Score”The Consistency Score measures how reliably a stock has historically performed during the selected period, combining its win rate, average return and stability of returns.
A higher score indicates stronger and more consistent historical performance.
Current Month Performance
Section titled “Current Month Performance”Shows how the stock is performing during the current instance of the selected month.
This allows traders to compare current behaviour with historical seasonal tendencies.
Vs Historical Avg
Section titled “Vs Historical Avg”Compares the current return with the stock’s historical average return for the selected month.
- Above: More than 50% above the historical average.
- Below: More than 33% below the historical average.
- In Line: Current return is within these ranges.
2. Historical Swing Screener
Section titled “2. Historical Swing Screener”The Historical Swing Screener helps traders identify stocks based on how they have historically performed after entering on a particular date and holding for a selected period.
Instead of analysing an entire calendar month, this view focuses on a specific historical scenario.
For example:
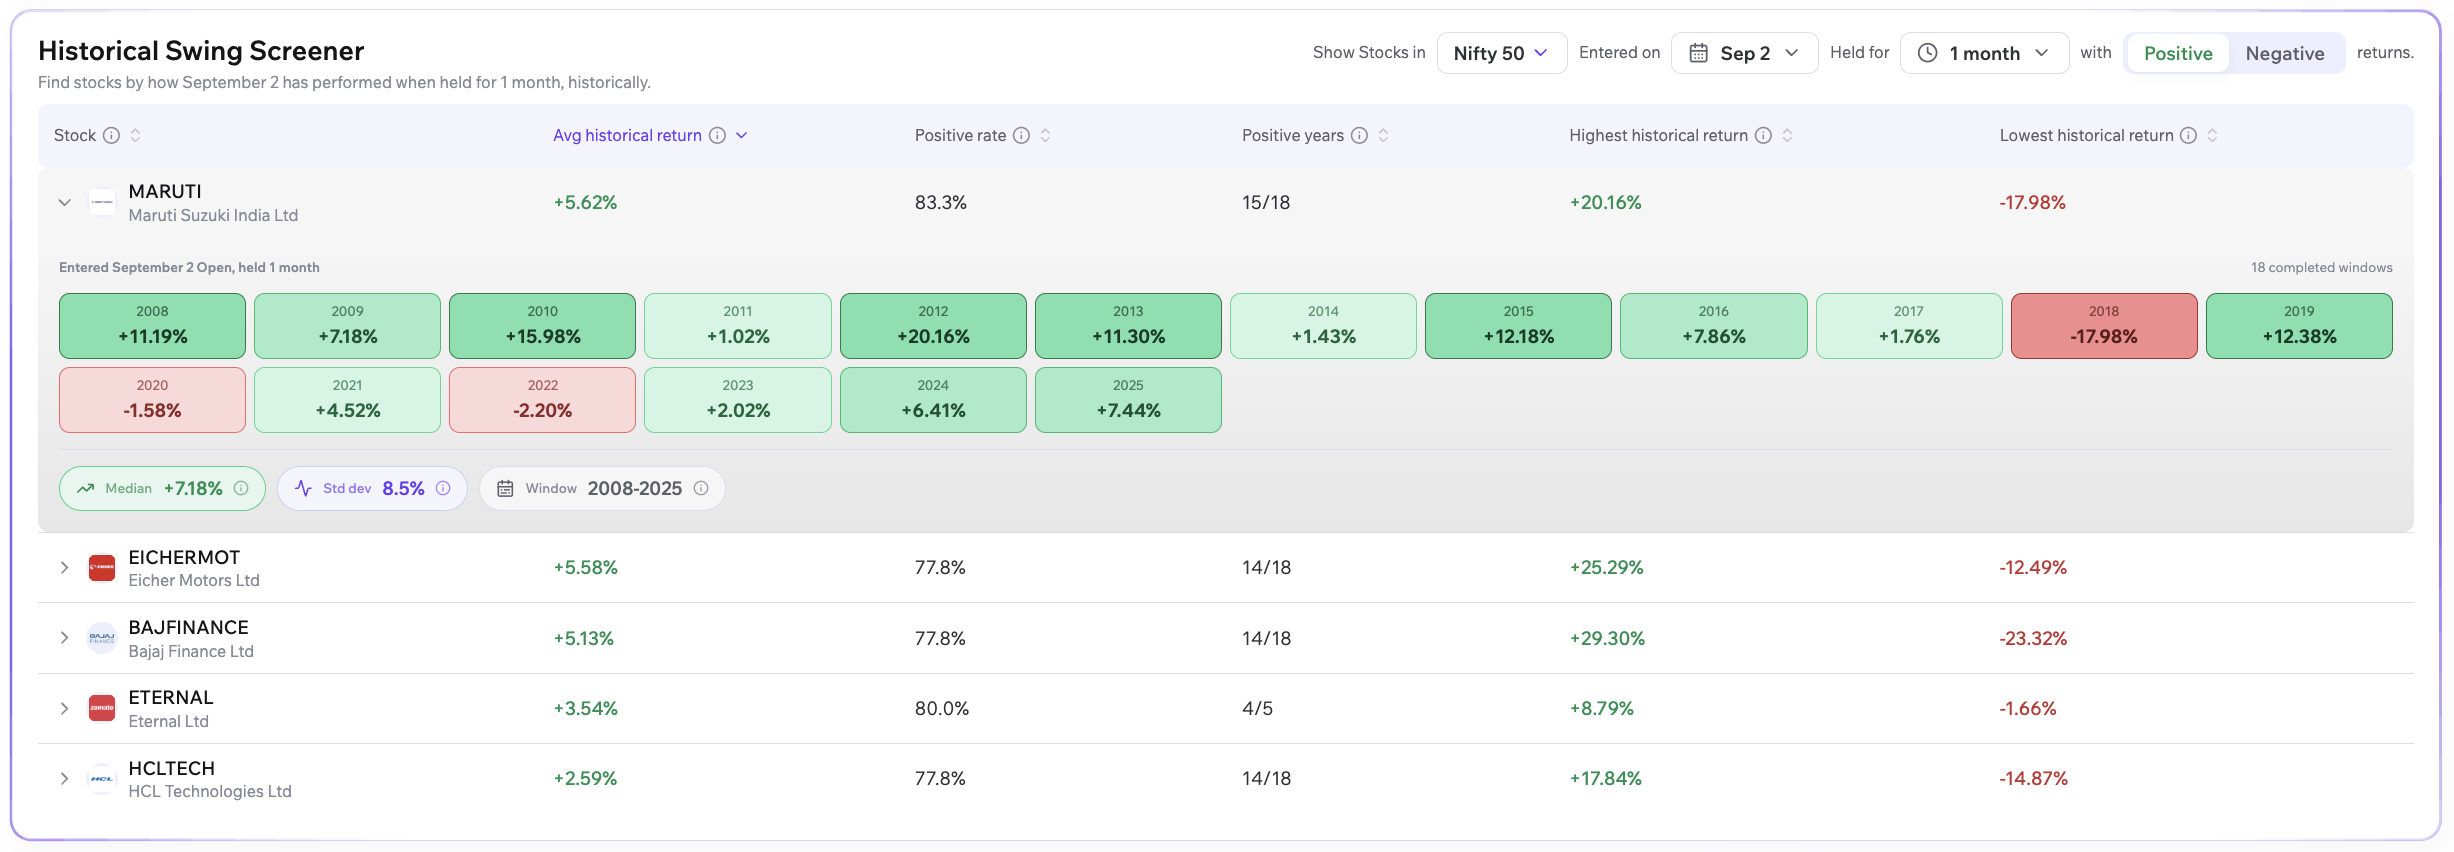
Show stocks in the Nifty 50 that, when entered on September 2 and held for one month, have historically generated positive returns.
Tradomate then analyses this scenario across previous years.
Available Controls
Section titled “Available Controls”The Historical Swing Screener allows traders to select:
- Stocks / Indices
- Stock Universe
- Entry Date
- Holding Period
- Positive / Negative Returns
Understanding the Results
Section titled “Understanding the Results”The table includes:
Average Historical Return
Section titled “Average Historical Return”The average return generated across all historical instances of the selected entry date and holding period.
Positive Rate
Section titled “Positive Rate”The percentage of historical occurrences that generated a positive return.
Positive Years
Section titled “Positive Years”Shows how many analysed historical periods produced positive returns.
Highest and Lowest Historical Return
Section titled “Highest and Lowest Historical Return”Shows the best and worst returns generated across historical occurrences.
These metrics help traders understand both the typical historical outcome and the range of outcomes.
Expanding a Stock
Section titled “Expanding a Stock”Each stock can be expanded to view its individual historical occurrences for the selected holding period. The expanded view displays the return generated in each historical year based on the selected entry date and holding period.
For example:
- 2008: +11.19%
- 2009: +7.18%
- 2010: +15.98%
This makes it easier to identify whether strong historical performance is driven by consistent results or a small number of unusually strong periods.
The expanded view also provides:
- Median Return
- Standard Deviation
- Historical Window
The median helps represent the typical historical outcome without extreme observations having a disproportionate impact.
Standard deviation indicates how widely historical outcomes have varied.
3. Monthly Returns Heatmap
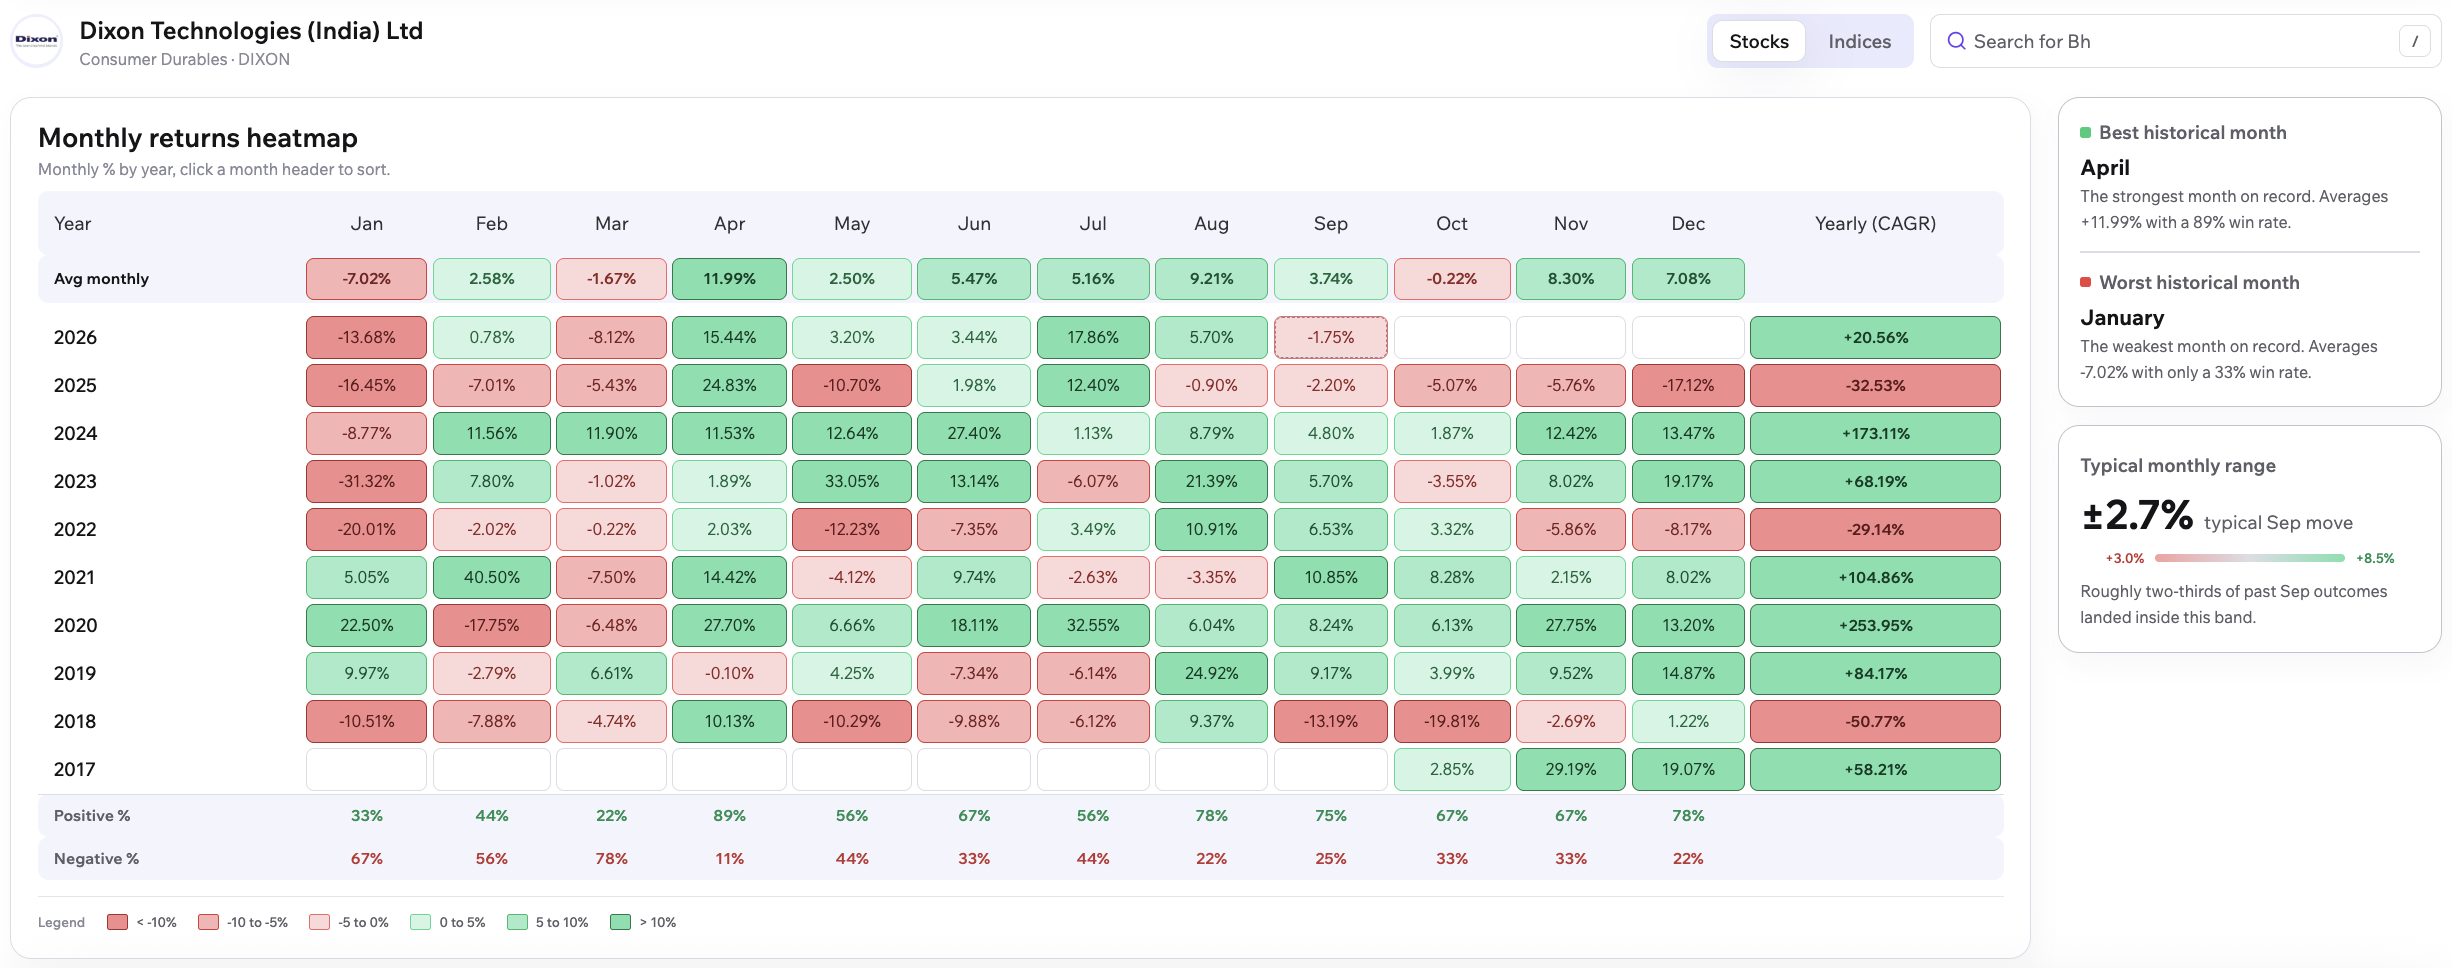
Section titled “3. Monthly Returns Heatmap”The Monthly Returns Heatmap provides a year-by-year view of how a selected stock or index has performed during each month.
Rows represent historical years, while columns represent January to December.
This makes it easier to identify recurring seasonal patterns.
For example:
Does this stock historically perform well in April?
or:
Which months have historically been the weakest?
Understanding the Heatmap
Section titled “Understanding the Heatmap”Each cell represents the return generated during a particular month in a particular year.
The colour of each cell provides a quick visual indication of return direction and magnitude:
- Positive returns are displayed using green shades.
- Negative returns are displayed using red shades.
Average Monthly Performance
Section titled “Average Monthly Performance”The top row displays the average historical performance for each month, providing a quick summary of historical seasonal behaviour.
Positive Percentage
Section titled “Positive Percentage”The bottom section shows the percentage of historical years in which each month generated a positive return.
This helps distinguish between:
- Months with high average returns but inconsistent outcomes.
- Months with moderate returns but stronger consistency.
Yearly CAGR
Section titled “Yearly CAGR”The heatmap also displays yearly performance, providing broader context for how monthly returns occurred within each historical year.
Historical Seasonality Insights
Section titled “Historical Seasonality Insights”Alongside the heatmap, Tradomate highlights:
Best Historical Month
Section titled “Best Historical Month”The month with the strongest historical average performance.
Worst Historical Month
Section titled “Worst Historical Month”The month with the weakest historical average performance.
Typical Monthly Range
Section titled “Typical Monthly Range”An indication of the typical range of monthly price movement.
How the Three Views Work Together
Section titled “How the Three Views Work Together”Seasonality Analysis is designed to support a progressive research workflow.
Step 1: Identify Broad Seasonal Patterns
Section titled “Step 1: Identify Broad Seasonal Patterns”Use Stock Performance to identify stocks that have historically performed well or poorly during a particular month.
For example:
Find stocks that have historically performed positively in August.
Step 2: Test a Specific Historical Scenario
Section titled “Step 2: Test a Specific Historical Scenario”Use the Historical Swing Screener to explore a specific entry date and holding period.
For example:
Enter on August 26 and hold for one month.
This moves from broad monthly seasonality towards a more specific historical scenario.
Step 3: Inspect the Full Historical Pattern
Section titled “Step 3: Inspect the Full Historical Pattern”Use the Monthly Returns Heatmap to understand the broader year-by-year seasonal behaviour of an individual stock.
This helps traders examine:
- Whether a pattern has recurred across years.
- Which months have historically been strongest or weakest.
- Whether average performance has been relatively consistent.
What Seasonality Analysis Is Not
Section titled “What Seasonality Analysis Is Not”Seasonality Analysis is:
- Not a prediction engine.
- Not a guarantee that historical patterns will repeat.
- Not a trading recommendation.
- Not a standalone signal generator.
Historical seasonal behaviour can change due to market conditions, company-specific developments, macroeconomic events and broader structural changes.
The purpose of Seasonality Analysis is to provide historical context for research and analysis.