Chart Pattern Detector
The Chart Pattern Detector helps you find stocks currently forming recognised chart patterns and explore how these patterns have performed historically.
It brings pattern detection and historical performance information together, allowing you to explore stocks across different market baskets, timeframes, and chart patterns.
Finding Chart Patterns
Section titled “Finding Chart Patterns”Select a Stock Basket
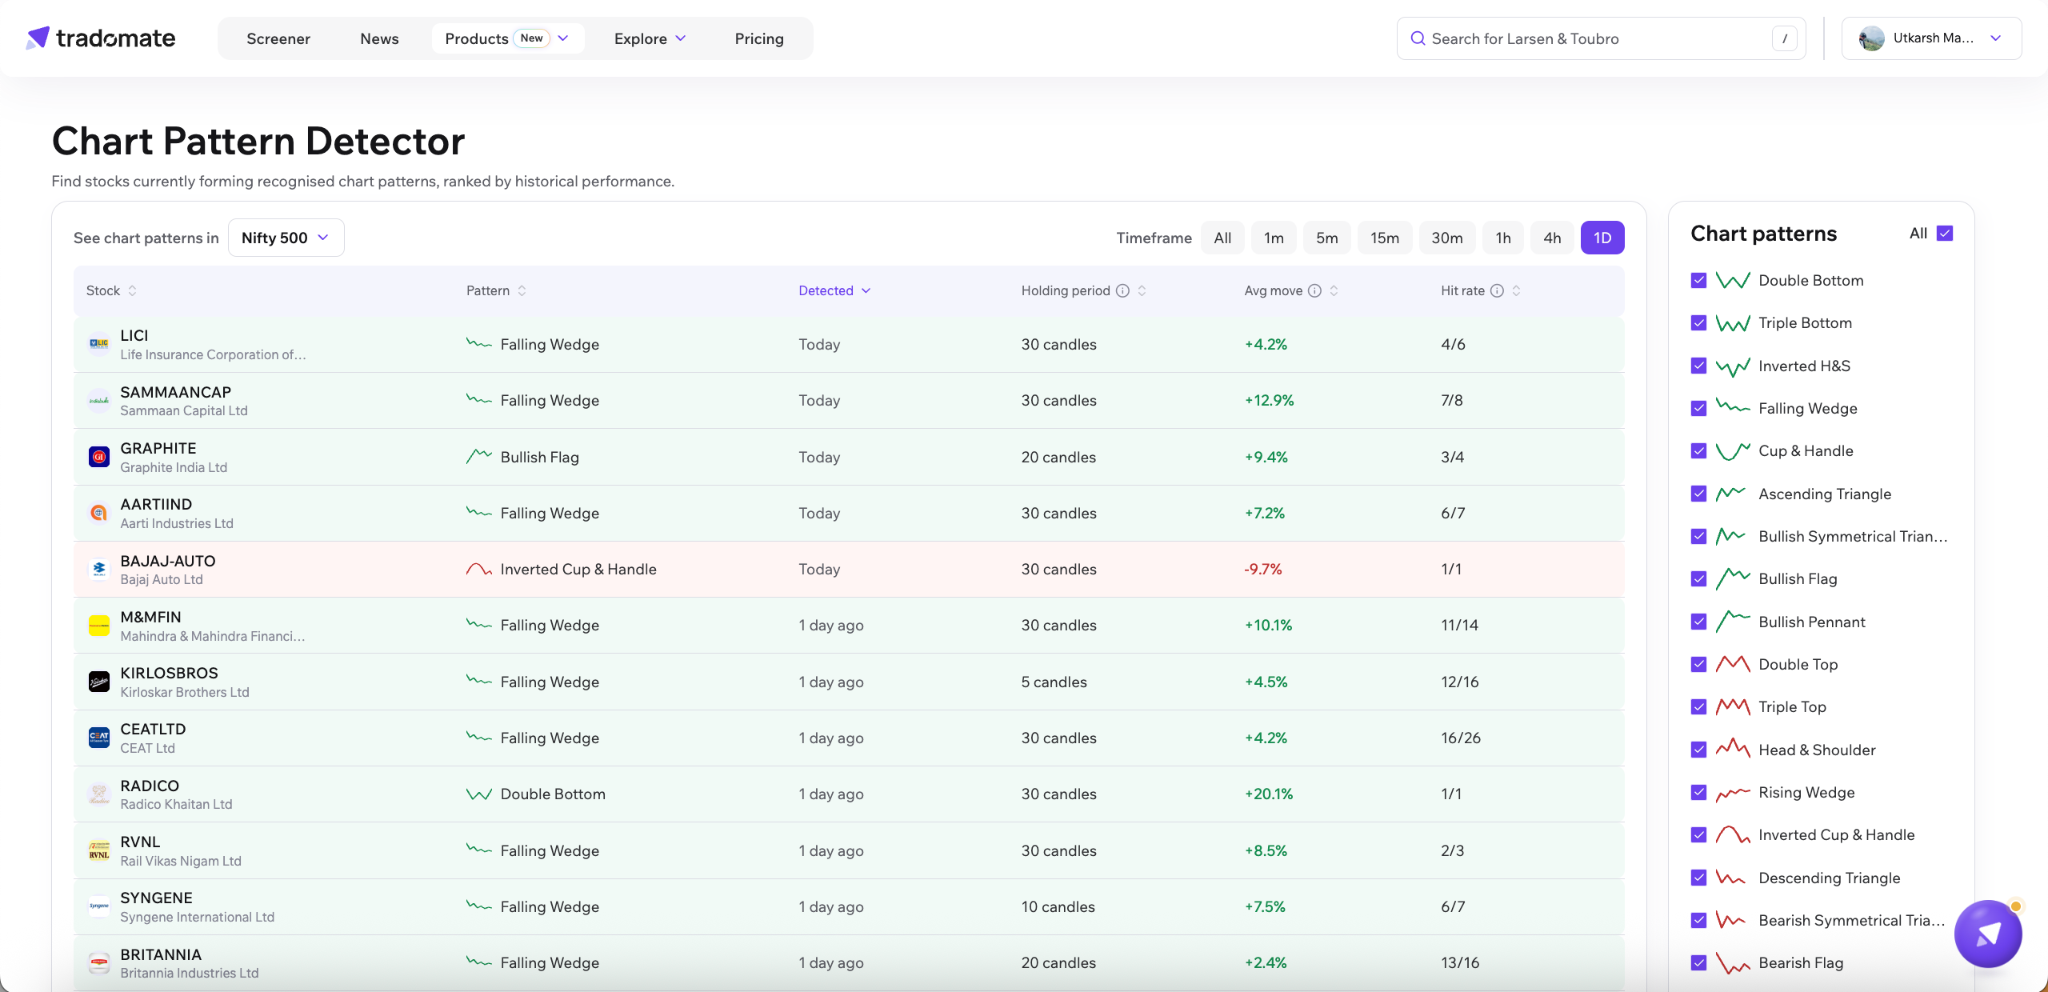
Section titled “Select a Stock Basket”Use the stock basket selector to choose the universe of stocks you want to analyse, such as Nifty 500.
The results table displays stocks matching the selected chart pattern filters within the chosen basket.
Select a Timeframe
Section titled “Select a Timeframe”Use the timeframe filters above the results table to focus on patterns detected across different intervals.
The available options shown in the interface include:
- All
- 1m
- 5m
- 15m
- 30m
- 1h
- 4h
- 1D
Selecting a timeframe helps you focus on patterns relevant to the interval you want to analyse.
Filter by Chart Pattern
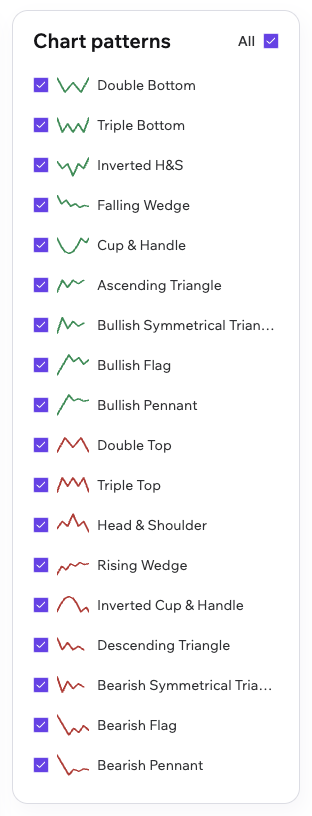
Section titled “Filter by Chart Pattern”The panel on the right lists the available chart patterns, each accompanied by a visual representation of its price structure.
Select individual patterns to include them in the results, or use the All option to select all available patterns.
This allows you to focus on specific formations, such as Double Bottom, Falling Wedge, or Bullish Flag, instead of reviewing every available pattern.
Understanding the Results Table
Section titled “Understanding the Results Table”The results table displays the stocks in which patterns have been detected, along with information about the patterns and their historical performance.
The table includes the following columns:
| Column | Description |
|---|---|
| Stock | The stock in which the chart pattern was detected. |
| Pattern | The name and visual representation of the detected chart pattern. |
| Detected | When the pattern was detected. |
| Holding Period | The holding period associated with the displayed historical performance. |
| Avg Move | The average price movement associated with the historical occurrences represented, measured in the direction of the pattern. |
| Hit Rate | The historical success count relative to the total occurrences represented. |
All table columns are sortable, allowing you to reorder results based on the information you want to compare.
For example, you can sort by Avg Move to compare historical price movements or by Hit Rate to compare historical success counts.
Understanding Historical Performance
Section titled “Understanding Historical Performance”The historical performance metrics provide additional context for evaluating detected chart patterns.
- Avg Move summarises the average price movement associated with the historical occurrences represented in the results.
- Hit Rate shows the historical success count relative to the total occurrences represented.
- Holding Period indicates the holding period associated with the displayed historical performance.
These metrics help you compare patterns and review their historical behaviour across stocks.
However, historical performance can vary across stocks, timeframes, and market conditions. A pattern with a higher historical Hit Rate or Avg Move does not guarantee a similar outcome when it appears again.
Navigating More Results
Section titled “Navigating More Results”The results table is divided into pages. Use Previous and Next at the bottom of the table to navigate between pages and explore additional stocks with detected patterns.
This allows you to review more results while keeping your selected basket, timeframe, and pattern filters.