Chart Patterns on Company Page
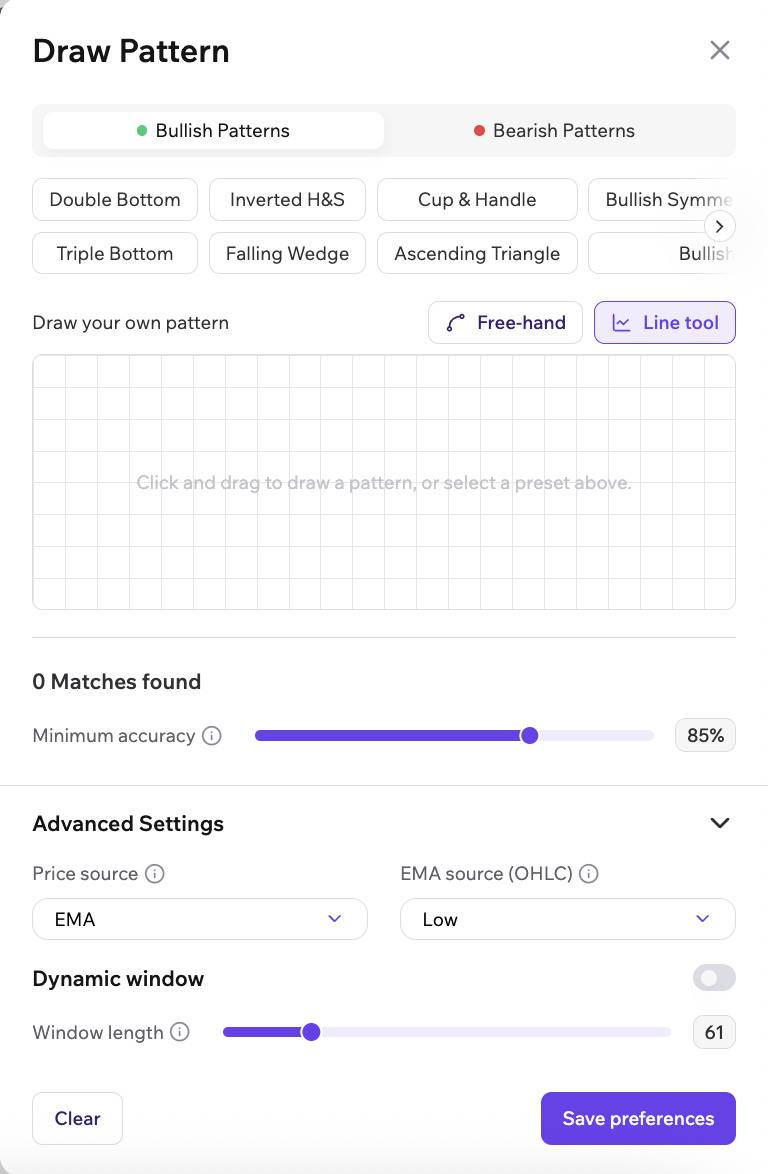
The Chart Patterns feature on the Company Page helps you identify and explore chart patterns for an individual stock/index directly on its price chart.
Automatically Detected Patterns
Section titled “Automatically Detected Patterns”Tradomate automatically detects and plots the latest recognised chart pattern on the company chart, allowing you to visualise the pattern in the context of the stock’s price action.
Draw or Select a Chart Pattern
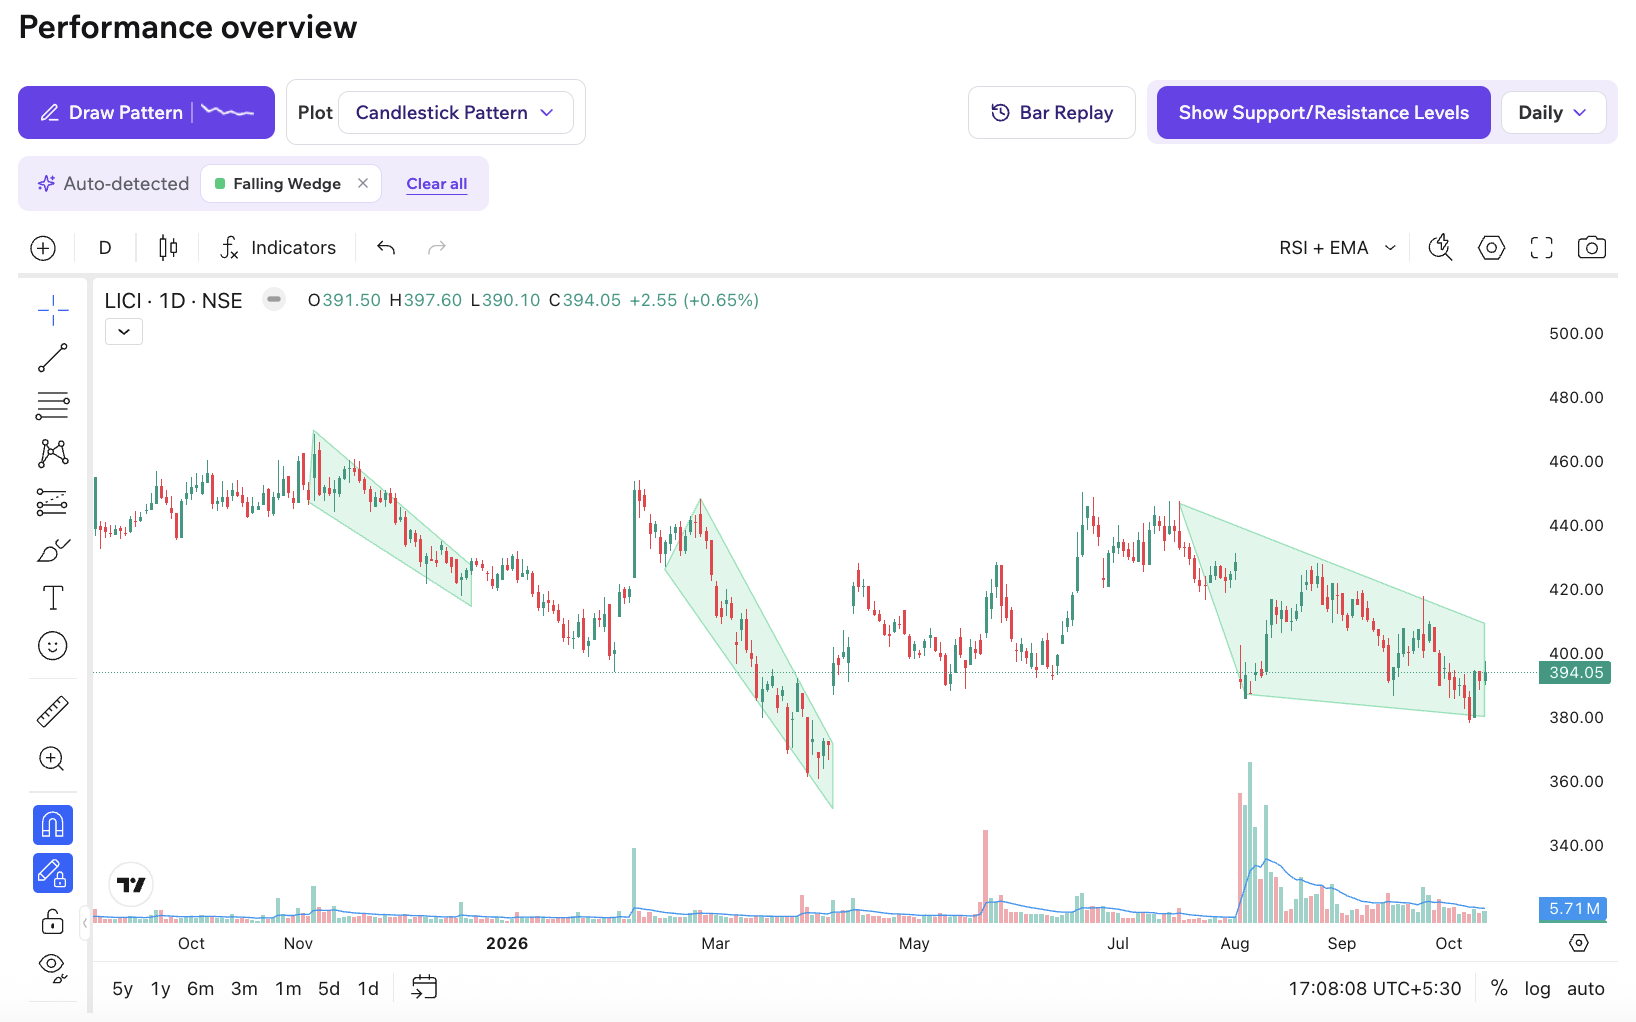
Section titled “Draw or Select a Chart Pattern”Click Draw Pattern to open the pattern selection dialog.
You can select a predefined pattern from the Bullish Patterns or Bearish Patterns categories, or draw your own pattern using the available drawing tools.
When you select a predefined pattern, Tradomate displays a preview of the pattern and lists the matches found on the stock’s chart. You can select a match from the list to explore that occurrence.
The dialog supports two drawing methods:
- Free-hand: Draw a pattern by hand.
- Line tool: Draw a pattern using connected lines.
Advanced Settings
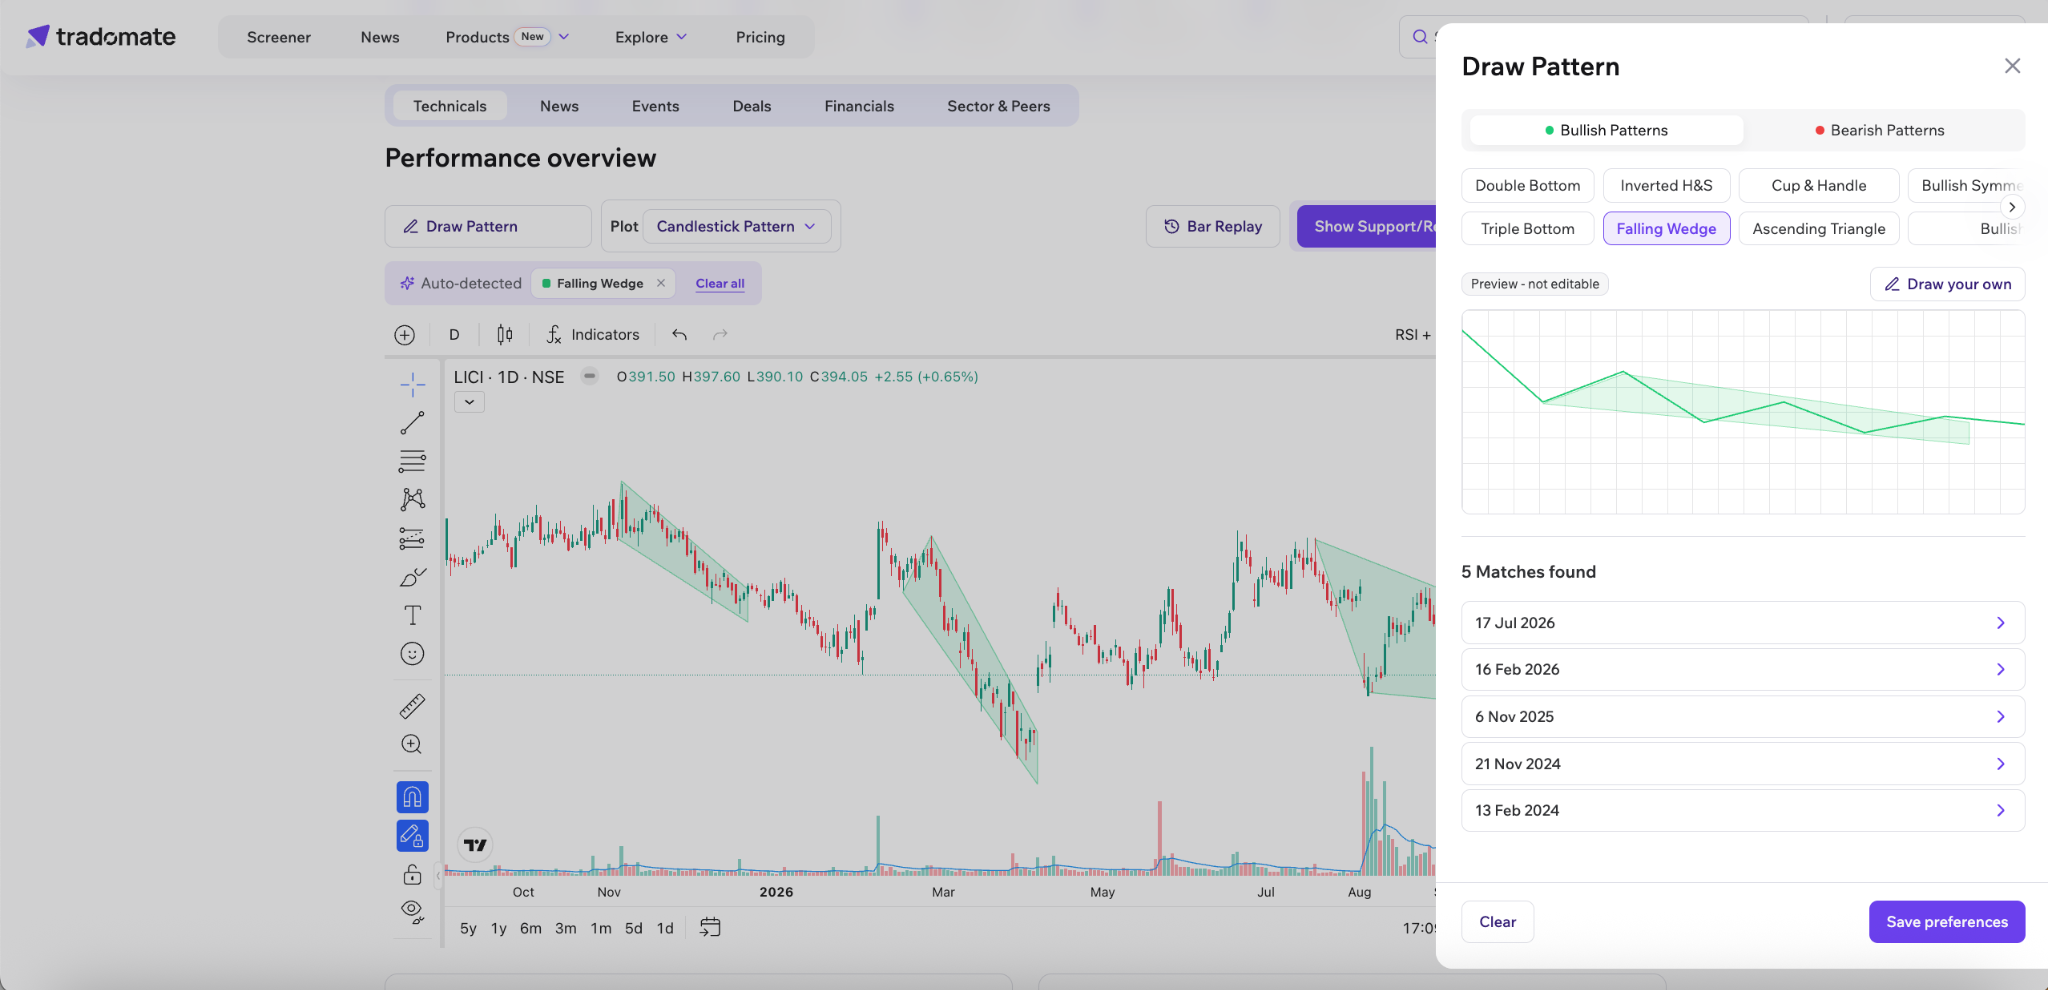
Section titled “Advanced Settings”Expand Advanced Settings to configure additional pattern detection options. These settings are available when drawing your own pattern.
The available settings include:
- Price source: Select the price source used for pattern detection.
- EMA source (OHLC): Select the relevant price input, such as Close.
- Dynamic window: Enable or disable the dynamic-window option.
- Window length: Configure the window length when applicable.
You can use Save preferences to save your selected settings.