Quick Start: Tradomate Stocks Validation
Stocks Validation in Tradomate helps you understand how the stocks currently matching your screener have historically performed whenever the same setup appeared in the past.
Unlike Market Backtesting, which evaluates your screener across an entire stock universe, Stocks Validation focuses only on the stocks currently returned by your screen. By combining historical occurrences, trade-level analysis, and holding period comparisons, it helps you evaluate the reliability of today’s opportunities before making a trading decision.
By default, Stocks Validation automatically runs using a 50-candle lookback every time your screener updates. You can rerun the validation using longer lookback periods for additional conviction.
Walkthrough Video
Section titled “Walkthrough Video”Watch the walkthrough below to see how Stocks Validation works and how to read its results.
How to Access Stocks Validation
Section titled “How to Access Stocks Validation”Stocks Validation runs automatically whenever your screener updates.
As soon as matching stocks are identified, Tradomate begins validating those stocks using a default 50-candle historical lookback.
You can rerun the validation using a different candle range whenever required.

Understanding Stocks Validation
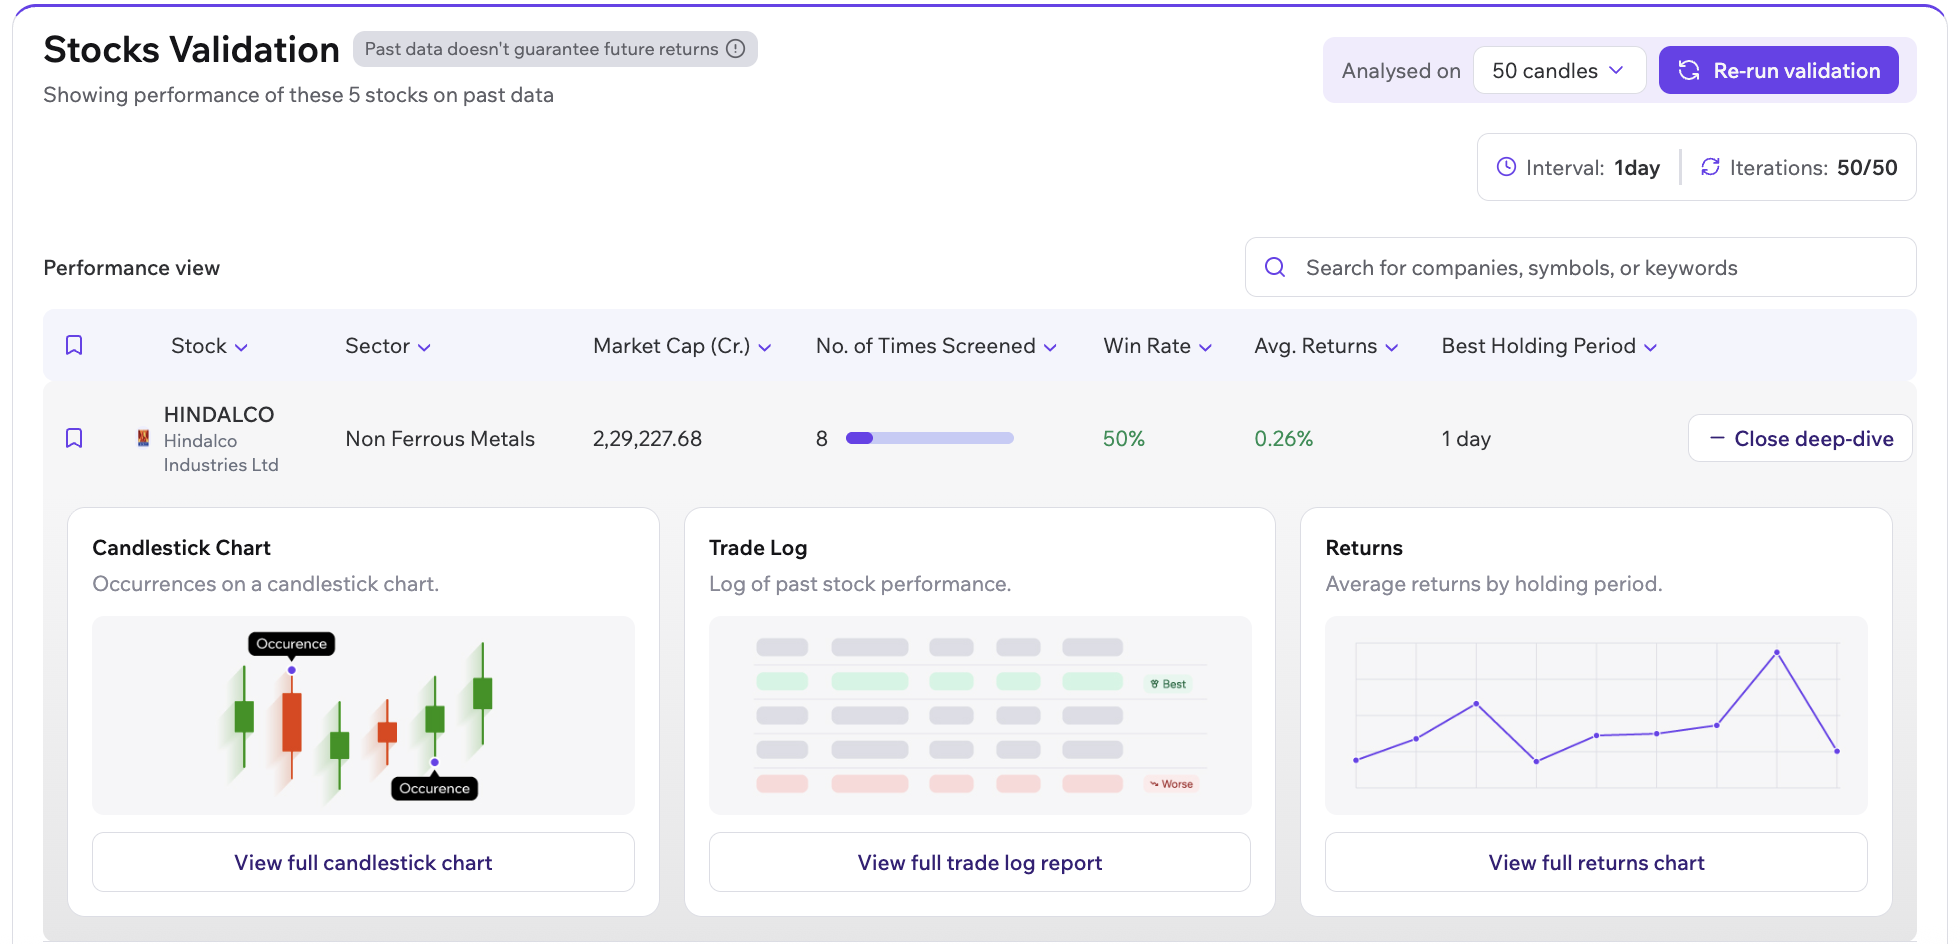
Section titled “Understanding Stocks Validation”The Stocks Validation table displays historical performance metrics for every stock currently matching your screener.
For each stock, you’ll find key statistics such as:
- Stock Name
- Sector
- Market Cap
- Number of Times Screened
- Best Holding Period
- Average Returns
- Win Rate
You can also:
- Search for any stock.
- Sort results by different columns.
- Compare historical performance across all matching stocks.
- Expand individual stocks for a deeper analysis.
Explore Individual Stocks
Section titled “Explore Individual Stocks”Click + Open deep-dive on any stock to open a detailed historical analysis.
Each stock is divided into three sections:
- Price Action
- Trade Log
- Returns
Together, these views help you understand how the same screener setup has historically behaved on that specific stock.
Price Action
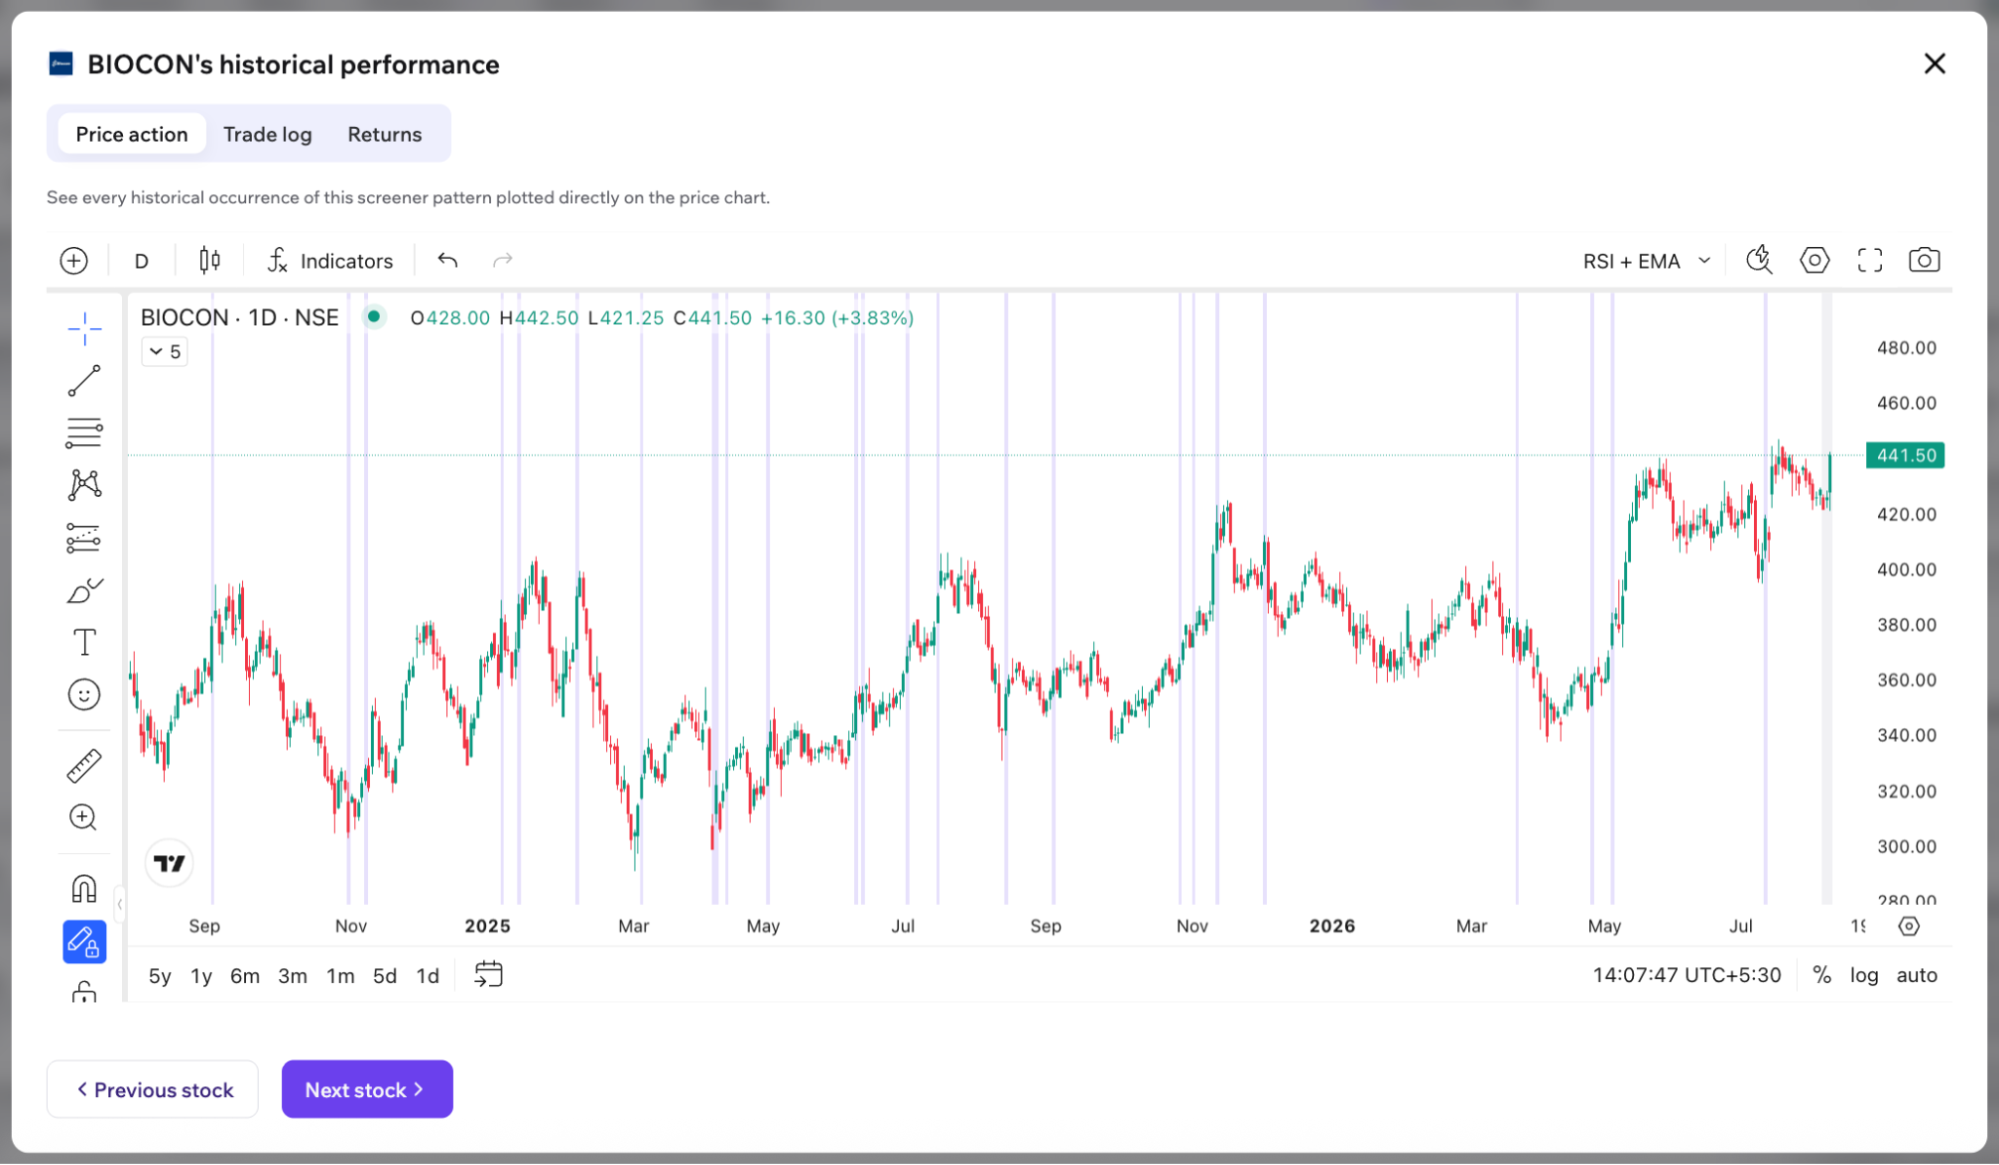
Section titled “Price Action”The Price Action tab displays the stock’s historical price chart with every historical occurrence of your screener highlighted.
This allows you to visually inspect how the stock behaved whenever the same screening conditions were met and compare how previous occurrences played out over time.
You can also use the navigation controls to quickly move between different screened stocks without leaving the validation view.
Trade Log
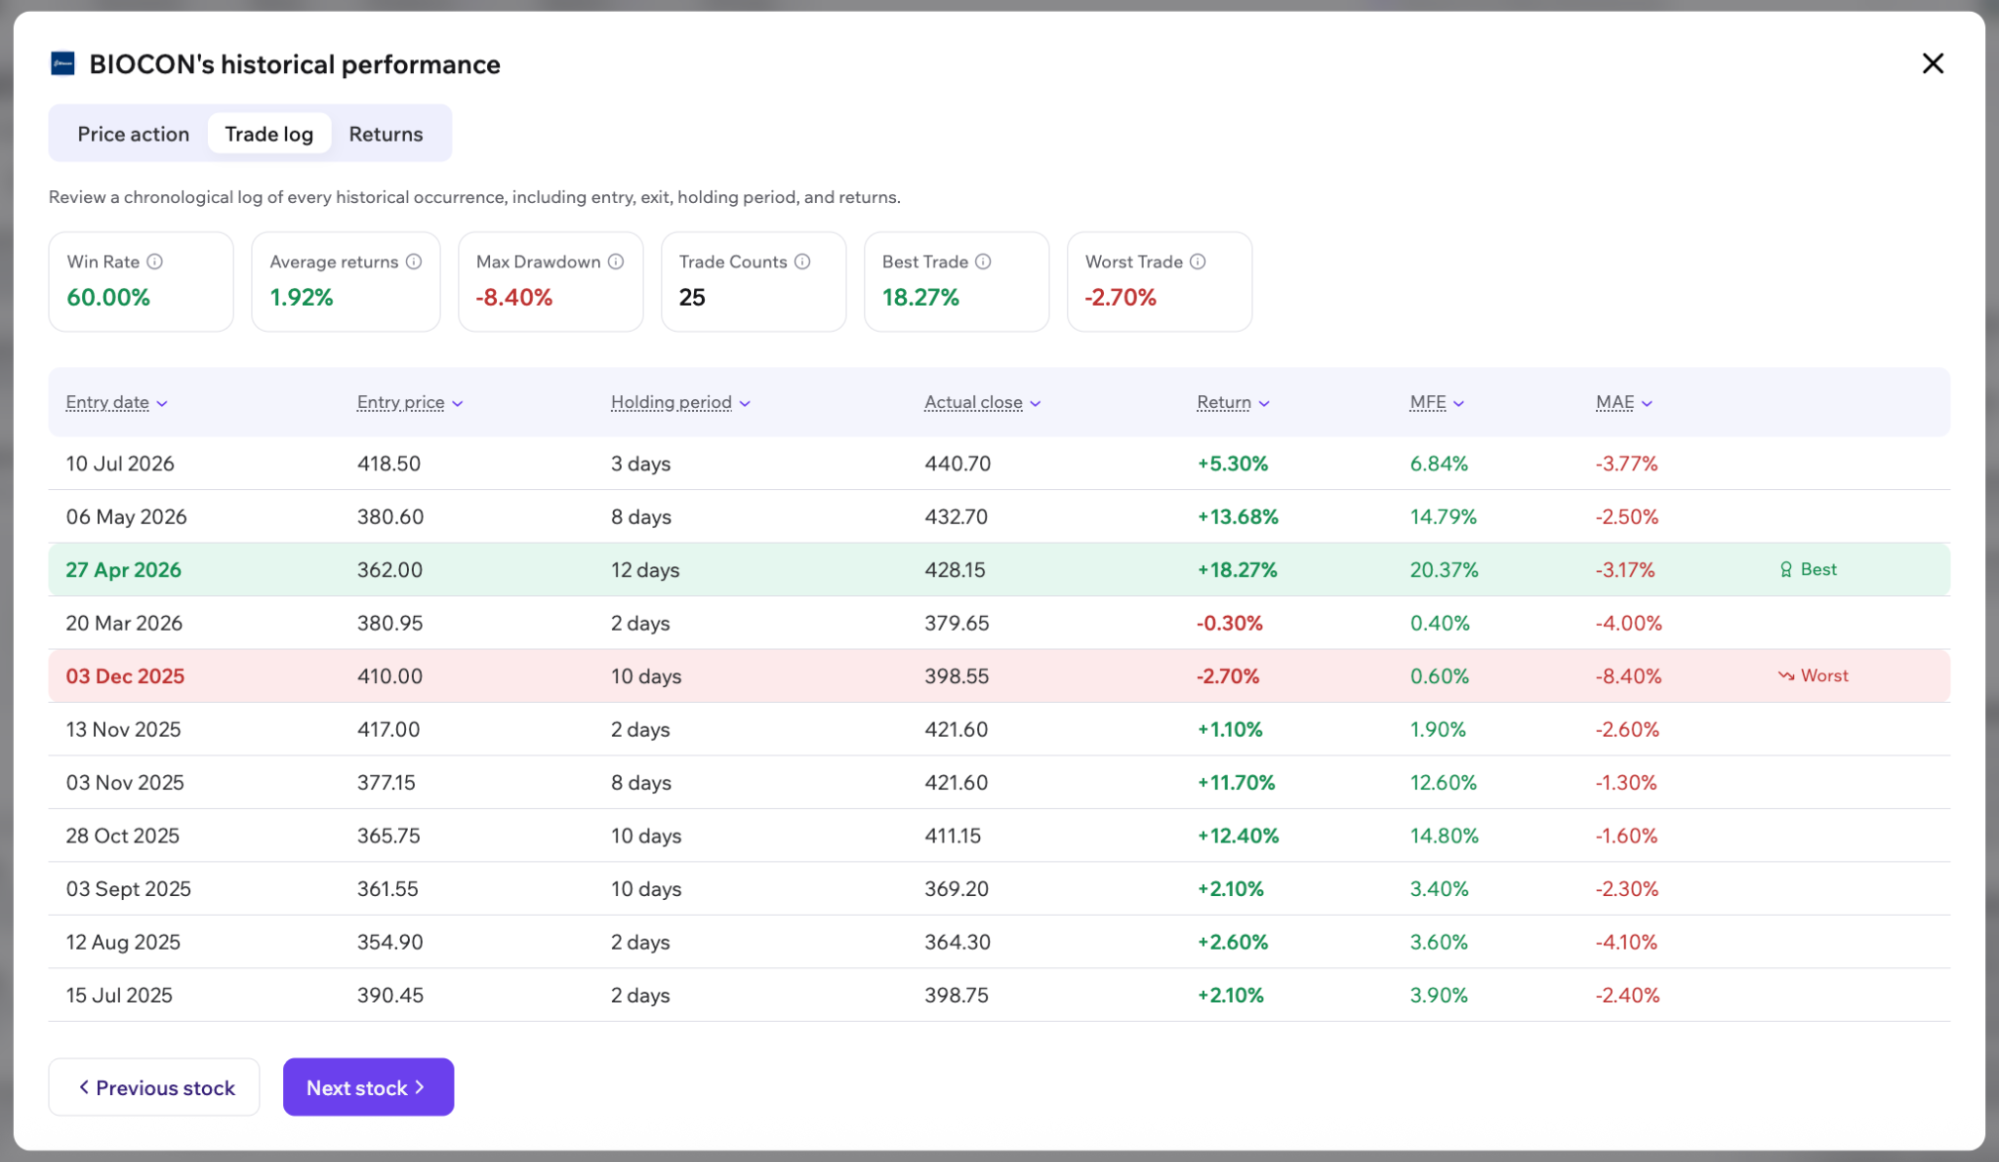
Section titled “Trade Log”The Trade Log provides a detailed record of every historical occurrence for the selected stock.
Each row represents one historical instance where your screener conditions were satisfied.
The table includes metrics such as:
- Entry Date
- Entry Price
- Holding Period
- Maximum Favourable Excursion (MFE)
- Maximum Adverse Excursion (MAE)
- Return
Performance summary chips displayed at the top provide a quick overview, including:
- Win Rate
- Average Return
- Trade Count
- Maximum Drawdown
- Best Trade
- Worst Trade
You can sort the trade log using any column to analyze historical performance more effectively.
Returns
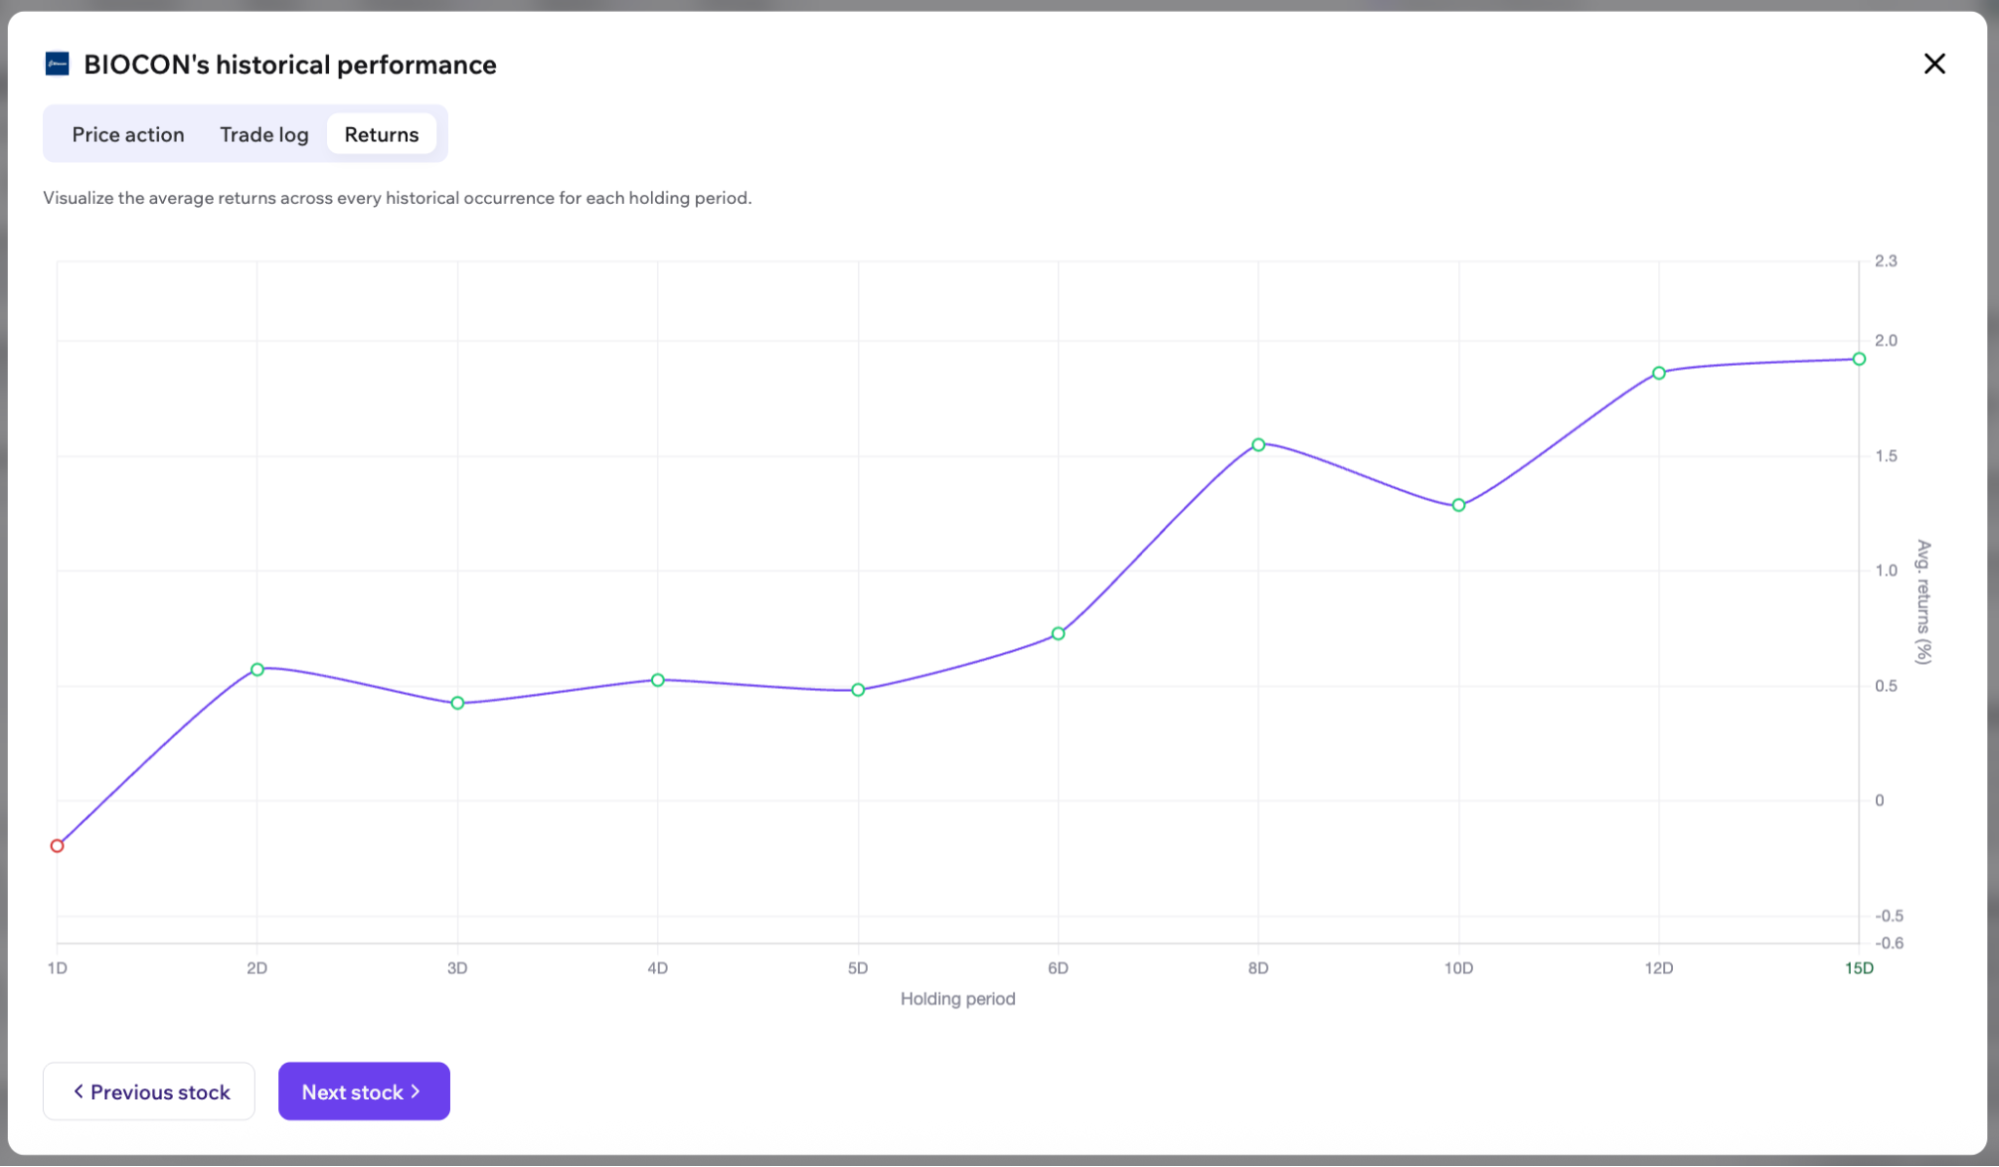
Section titled “Returns”The Returns tab helps you compare how the selected stock has historically performed across different holding periods.
The chart displays the stock’s average returns across all historical occurrences for multiple holding periods, making it easy to compare how performance changes with different holding durations and identify where the setup has historically performed best.
Hover over any point on the chart to view the exact average return for that holding period.
Performance summary chips include:
- Win Rate
- Average Return
- Trade Count
- Maximum Drawdown
- Profit Factor
- Average Risk/Reward Ratio
This view helps you determine the holding period that has historically delivered the strongest returns for the selected stock.
Why Stocks Validation Matters
Section titled “Why Stocks Validation Matters”Stocks Validation helps answer questions such as:
- Have these stocks historically performed well when this setup appeared?
- Which of today’s screened stocks has the strongest historical track record?
- What holding period has historically worked best for each stock?
- How often has this setup occurred?
- What returns and win rates have these stocks historically delivered?
- What levels of risk and drawdown have historically been observed?
Instead of evaluating your strategy across an entire market universe, Stocks Validation focuses on the opportunities currently in front of you, helping you validate today’s screened stocks using historical evidence before making a trading decision.