Quick Start: Tradomate Market Backtest
Market Backtest in Tradomate helps you understand how your screening strategy has historically performed across your selected stock universe. It identifies the best-performing stocks and sectors, optimal holding periods, and the historical reliability of your screener.
Unlike Stocks Validation, which analyzes only the stocks currently matching your screener, Market Backtest evaluates every historical occurrence of your screening conditions across the selected universe, helping you validate the strategy itself.
Walkthrough Video
Section titled “Walkthrough Video”Before exploring Market Backtest, watch the walkthrough below to understand how to run a backtest and interpret its historical performance.
How to Access Market Backtest
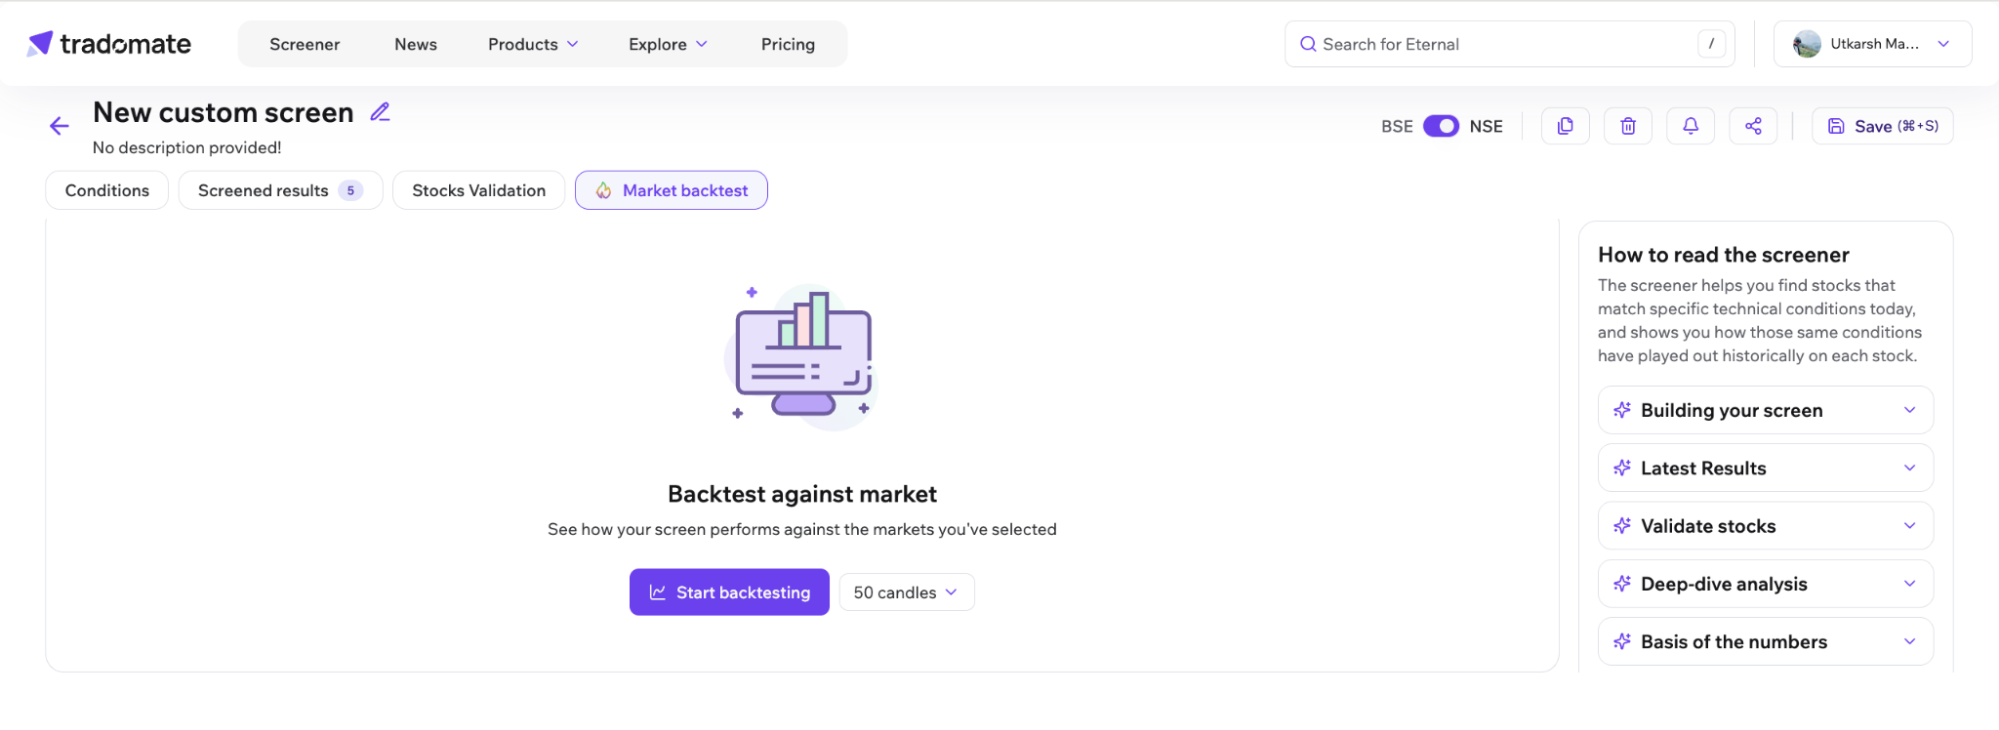
Section titled “How to Access Market Backtest”After running your screener, click Market Backtest from the header controls.
Choose a historical lookback period between 10 and 500 candles before running the backtest.
Step-by-Step Guide to Understanding Market Backtest
Section titled “Step-by-Step Guide to Understanding Market Backtest”1. Access Market Backtest
Section titled “1. Access Market Backtest”After running a Market Backtest, the results are divided into two sections:
- Overview for summarized strategy insights.
- Deep Dive for detailed stock-level analysis.
Together, these sections help you understand both the overall performance of your strategy and the historical behavior of individual stocks.
2. Understand Key Metrics
Section titled “2. Understand Key Metrics”Market Backtest calculates multiple performance indicators to measure both profitability and reliability.
| Metric | Definition |
|---|---|
| MFE (Maximum Favourable Excursion) | The best return achieved during a historical trade. Represents the maximum upside. |
| MAE (Maximum Adverse Excursion) | The largest drawdown observed during a historical trade. Represents downside risk. |
| Holding Period | The holding duration that has historically delivered the strongest average performance. |
All metrics are calculated using historical occurrences where the same screener conditions appeared across stocks within the selected universe.
Overview
Section titled “Overview”The Overview tab presents a summarized view of your Market Backtest, highlighting where your strategy has historically performed best.
Historical Performance
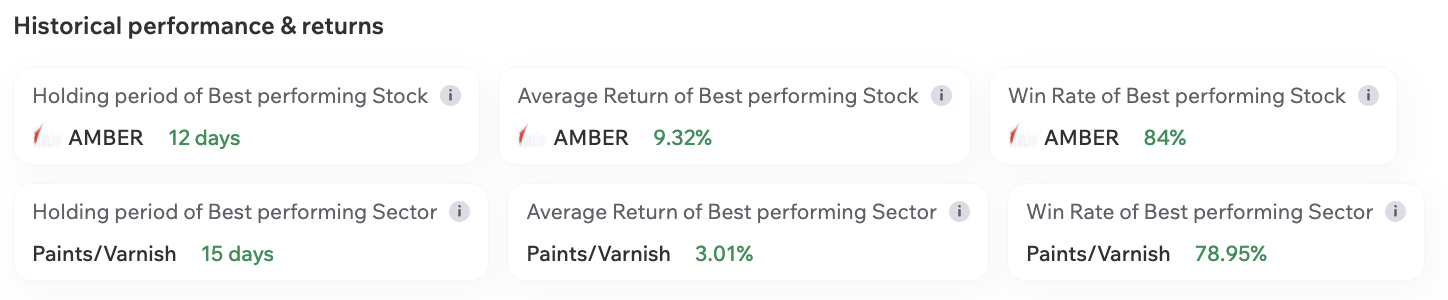
Section titled “Historical Performance”At the top of the Overview page, summary cards highlight your strongest historical performers.
These include:
- Best Performing Stock
- Average Return of the Best Performing Stock
- Win Rate of the Best Performing Stock
Similarly, sector-level cards identify the best-performing sectors based on your screener.
These insights help you quickly identify where your strategy has historically delivered the strongest results across both stocks and sectors.
Visual Analysis
Section titled “Visual Analysis”Scatter Plot
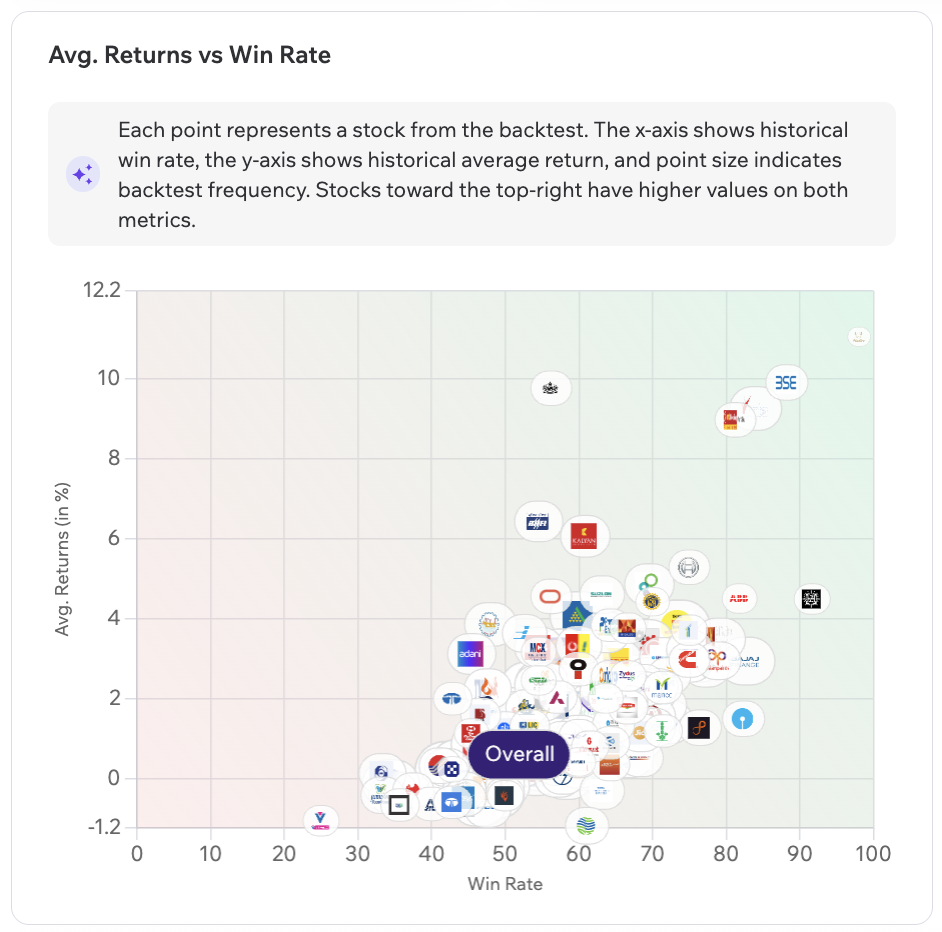
Section titled “Scatter Plot”The scatter plot compares the historical performance of every stock identified during the Market Backtest.
Each bubble represents a stock.
- X-axis: Win Rate
- Y-axis: Average Returns
- Bubble Size: Number of Historical Occurrences
Hover over any bubble to view:
- Stock Name
- Number of Occurrences
- Best Holding Period
- Average Return
- Win Rate
Stock Performance Across Holding Periods
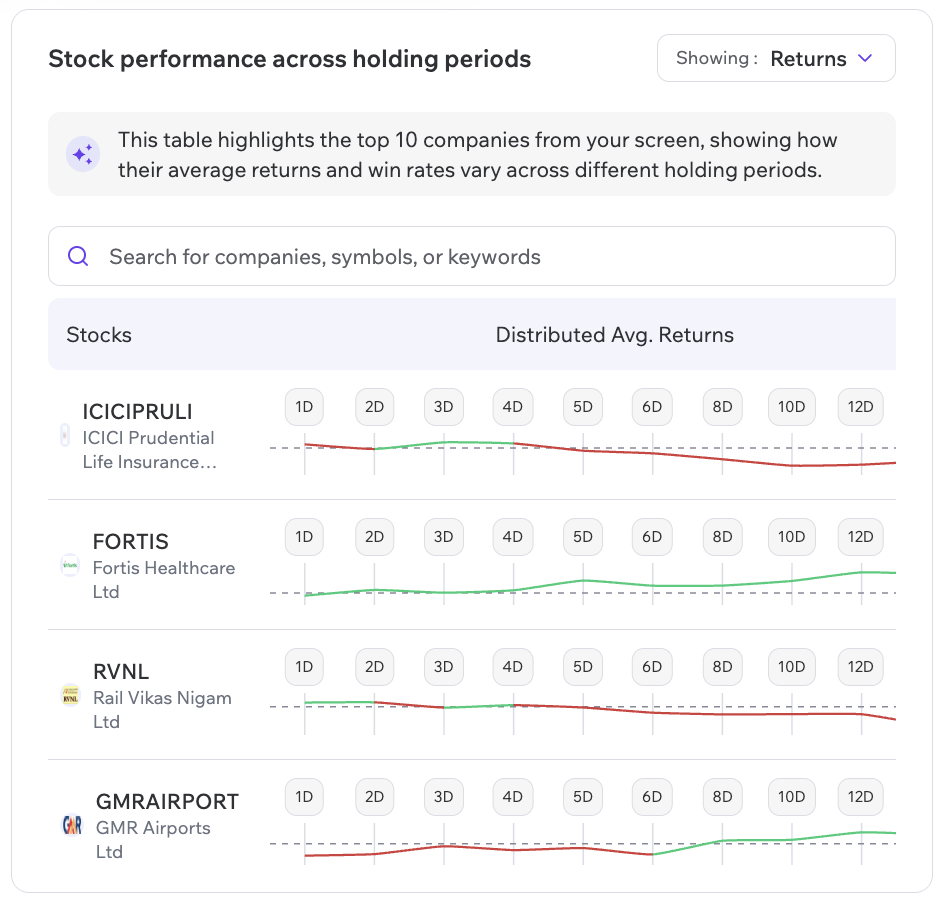
Section titled “Stock Performance Across Holding Periods”This section compares how different stocks have historically performed across multiple holding periods.
You can:
- Switch between Returns and Win Rate
- Search for individual stocks
- Compare historical performance across holding periods
- Hover over the chart to view exact values
This helps identify which holding period has historically delivered the strongest results for each stock.
Deep Dive
Section titled “Deep Dive”The Deep Dive tab allows you to inspect Market Backtest results in greater detail across timeframe, stock, sector, and historical occurrences.
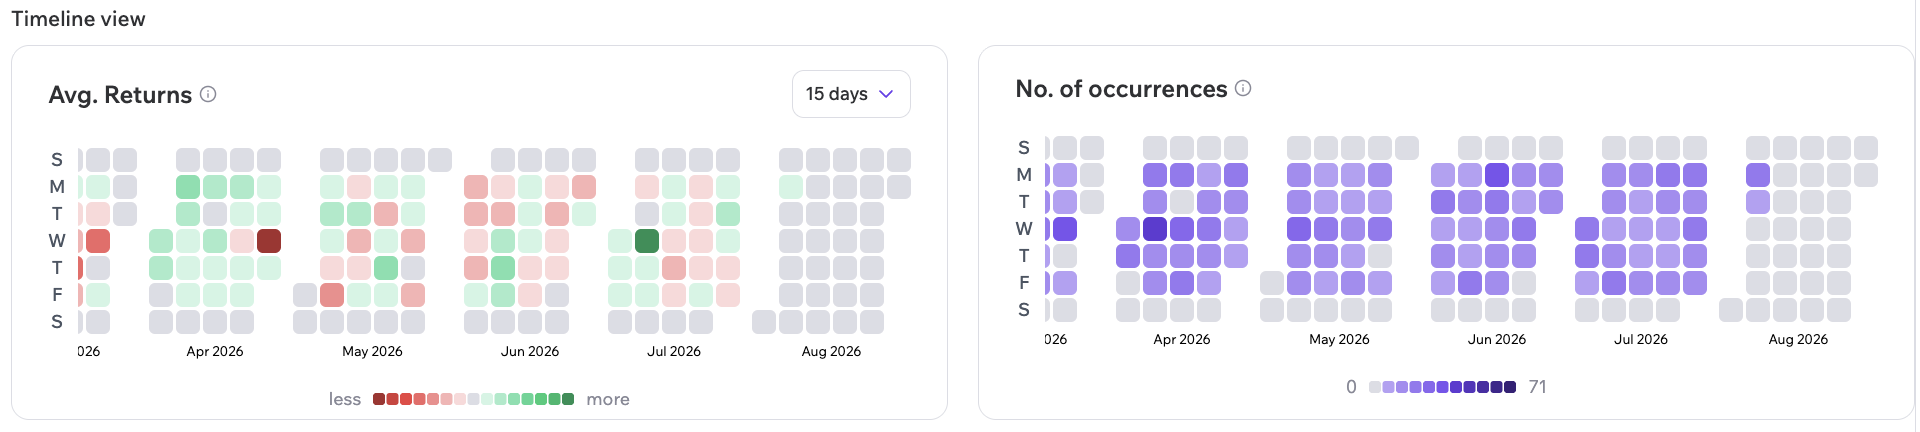
Heatmap - Timeline View
Section titled “Heatmap - Timeline View”Visualize how your strategy has historically performed across different holding periods.
Each cell represents the historical average return and occurrence count for a particular holding period, helping you identify periods where the strategy has historically performed well.
Use the holding period selector to dynamically update the heatmap.
Performance View
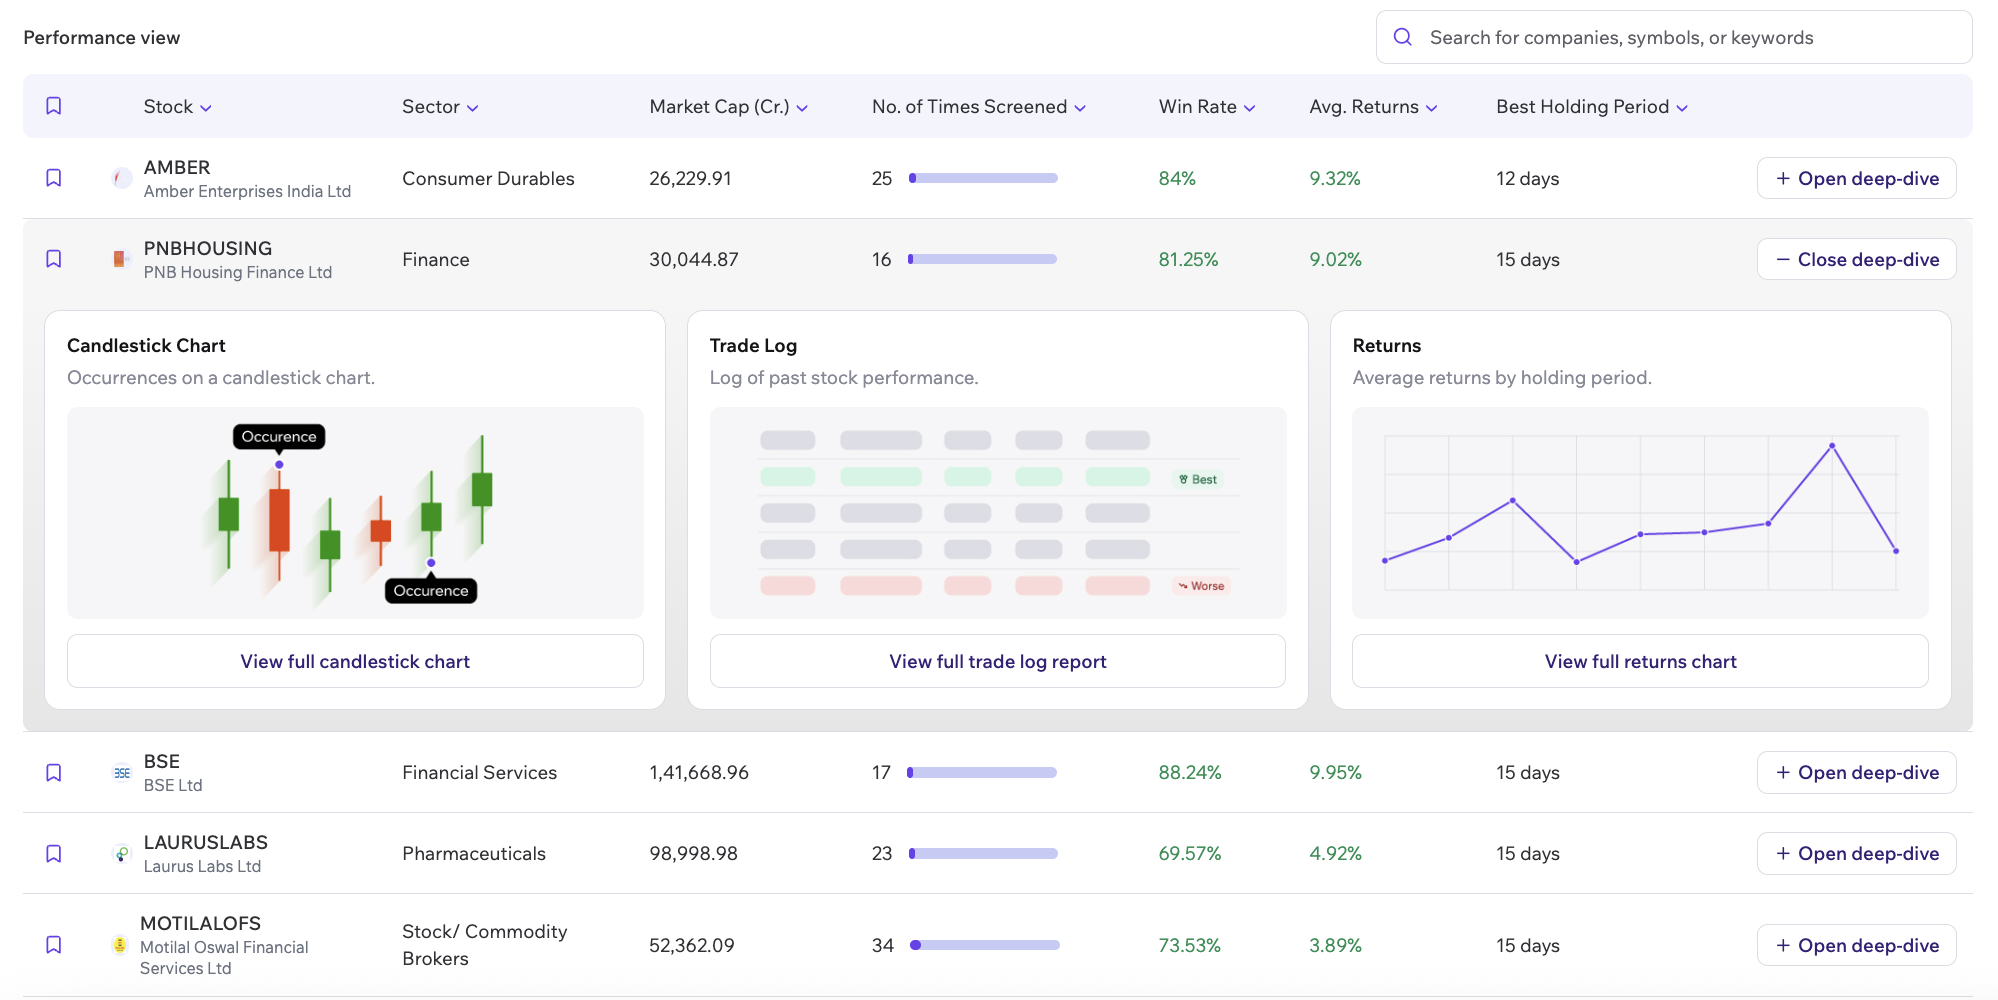
Section titled “Performance View”The Performance View table lists stock-level backtest results with sortable metrics and detailed historical insights.
The table includes metrics such as:
- Stock
- Sector
- Market Cap
- Number of Times Screened
- Best Holding Period
- Average Returns
- Win Rate
You can also:
- Search for any company.
- Sort by different columns.
- Filter by stock or sector.
- Sort by occurrences to identify frequently recurring setups.
Under the Details column, click Expand on any stock to inspect its historical performance in greater detail.
Each expanded view includes three tabs:
- Price Action – View the stock’s historical price chart with previous occurrences of your screener highlighted.
- Trade Log – Review every historical occurrence through a detailed trade-by-trade breakdown, along with key performance metrics.
- Returns – Compare the stock’s average historical returns across different holding periods to identify where the strategy has historically performed best.
These views allow you to move beyond summary metrics and understand how your strategy has historically behaved on individual stocks within the selected market universe.
Why Market Backtest Matters
Section titled “Why Market Backtest Matters”Market Backtest helps answer questions such as:
- Has this screening strategy historically worked?
- Which stocks and sectors have historically performed best?
- What holding period has historically delivered the strongest results?
- How often has this setup occurred?
- How consistent has the strategy been across the selected market universe?
While Stocks Validation helps you evaluate the stocks currently matching your screener, Market Backtest helps you validate the strategy itself across a broader market universe, giving you greater confidence before using it in live markets.
Start exploring your strategy’s full performance spectrum today and continue to #tradeIntelligently.