What Is a Tweezer Bottom Pattern: Everything You Need To Know
The tweezer bottom is a two-candle pattern that forms after a downtrend. Learn how to identify it, what it signals, and how to plot it on Tradomate.
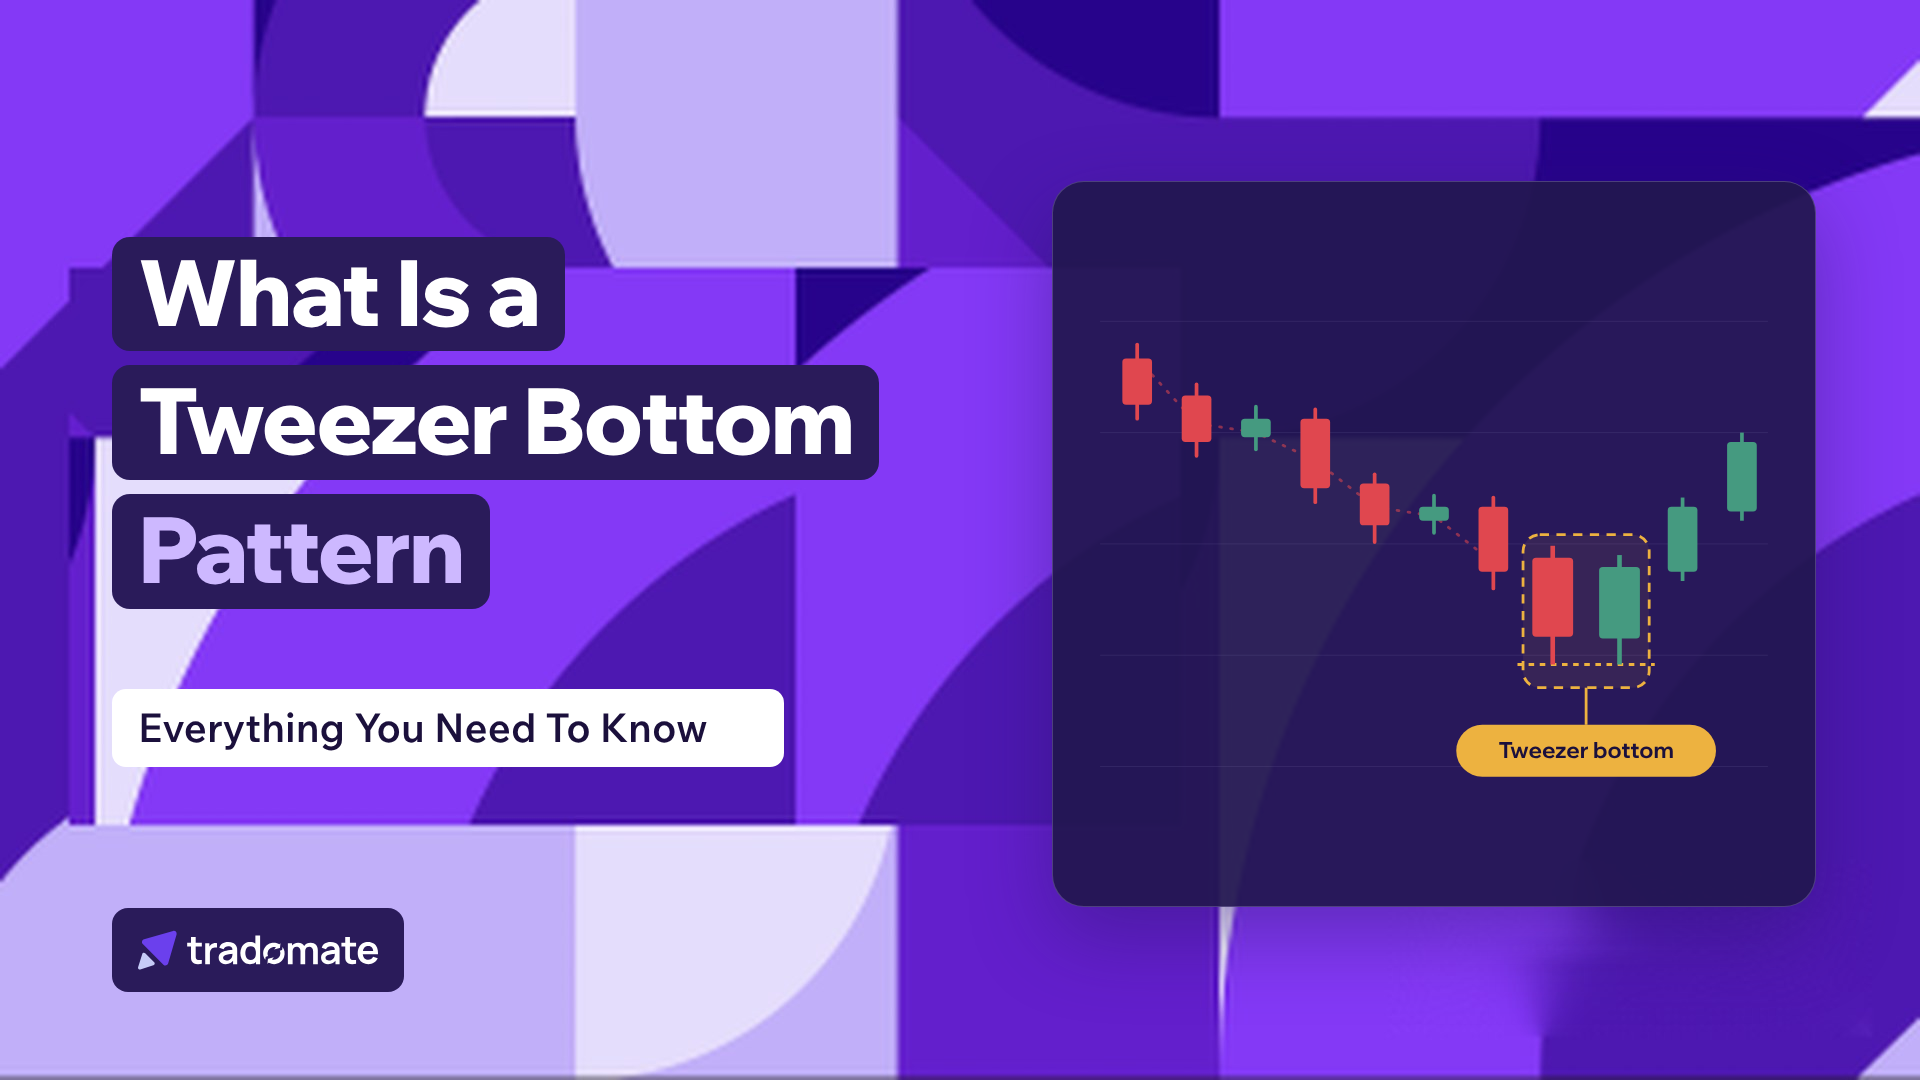
The tweezer bottom is a two-candle pattern that appears after a downtrend. Both candles reach the same, or nearly the same, low price.
It is called a bullish reversal pattern. This means it hints that the downtrend may be losing strength and buyers may be stepping in.
Its opposite is the tweezer top pattern, which appears after an uptrend.
How to Identify the Tweezer Bottom Pattern?
Here is a checklist of what makes a valid pattern.
- Downtrend: The price should be in a clear downtrend before the pattern appears.
- First candle: It should usually be red (bearish).
- Second candle: It should usually be green (bullish).
- Matching lows: Both candles should have the same or nearly the same low.
- No new low: The second candle should not make a lower low than the first.
What Does the Tweezer Bottom Pattern Signal?
Traders commonly read this pattern as a sign that selling pressure is fading and a floor may be forming. A few things are usually looked at along with it.
- Position in the trend: The pattern is only treated as a tweezer bottom after a clear downtrend.
- Support levels: Traders pay closer attention when the matching lows sit on a support level, or when they mark the stock’s lowest point in a long time.
- Volume: Lower volume on the first candle and higher volume on the second candle is seen as a stronger sign.
- Other patterns: The signal is seen as stronger when the two candles also form another bullish pattern, such as a bullish engulfing or a piercing line.
- Confirmation: Traders often wait for a third candle to confirm the pattern, such as a green candle that moves above the high of the two candles.
The pattern alone does not guarantee a rise. It only points to a possible change in direction.
How to Use the Tweezer Bottom Pattern on Tradomate?
Tradomate lets you plot candlestick patterns directly on the price chart. Here is how the tools work.
- Chart: The price chart sits under the Performance overview section.
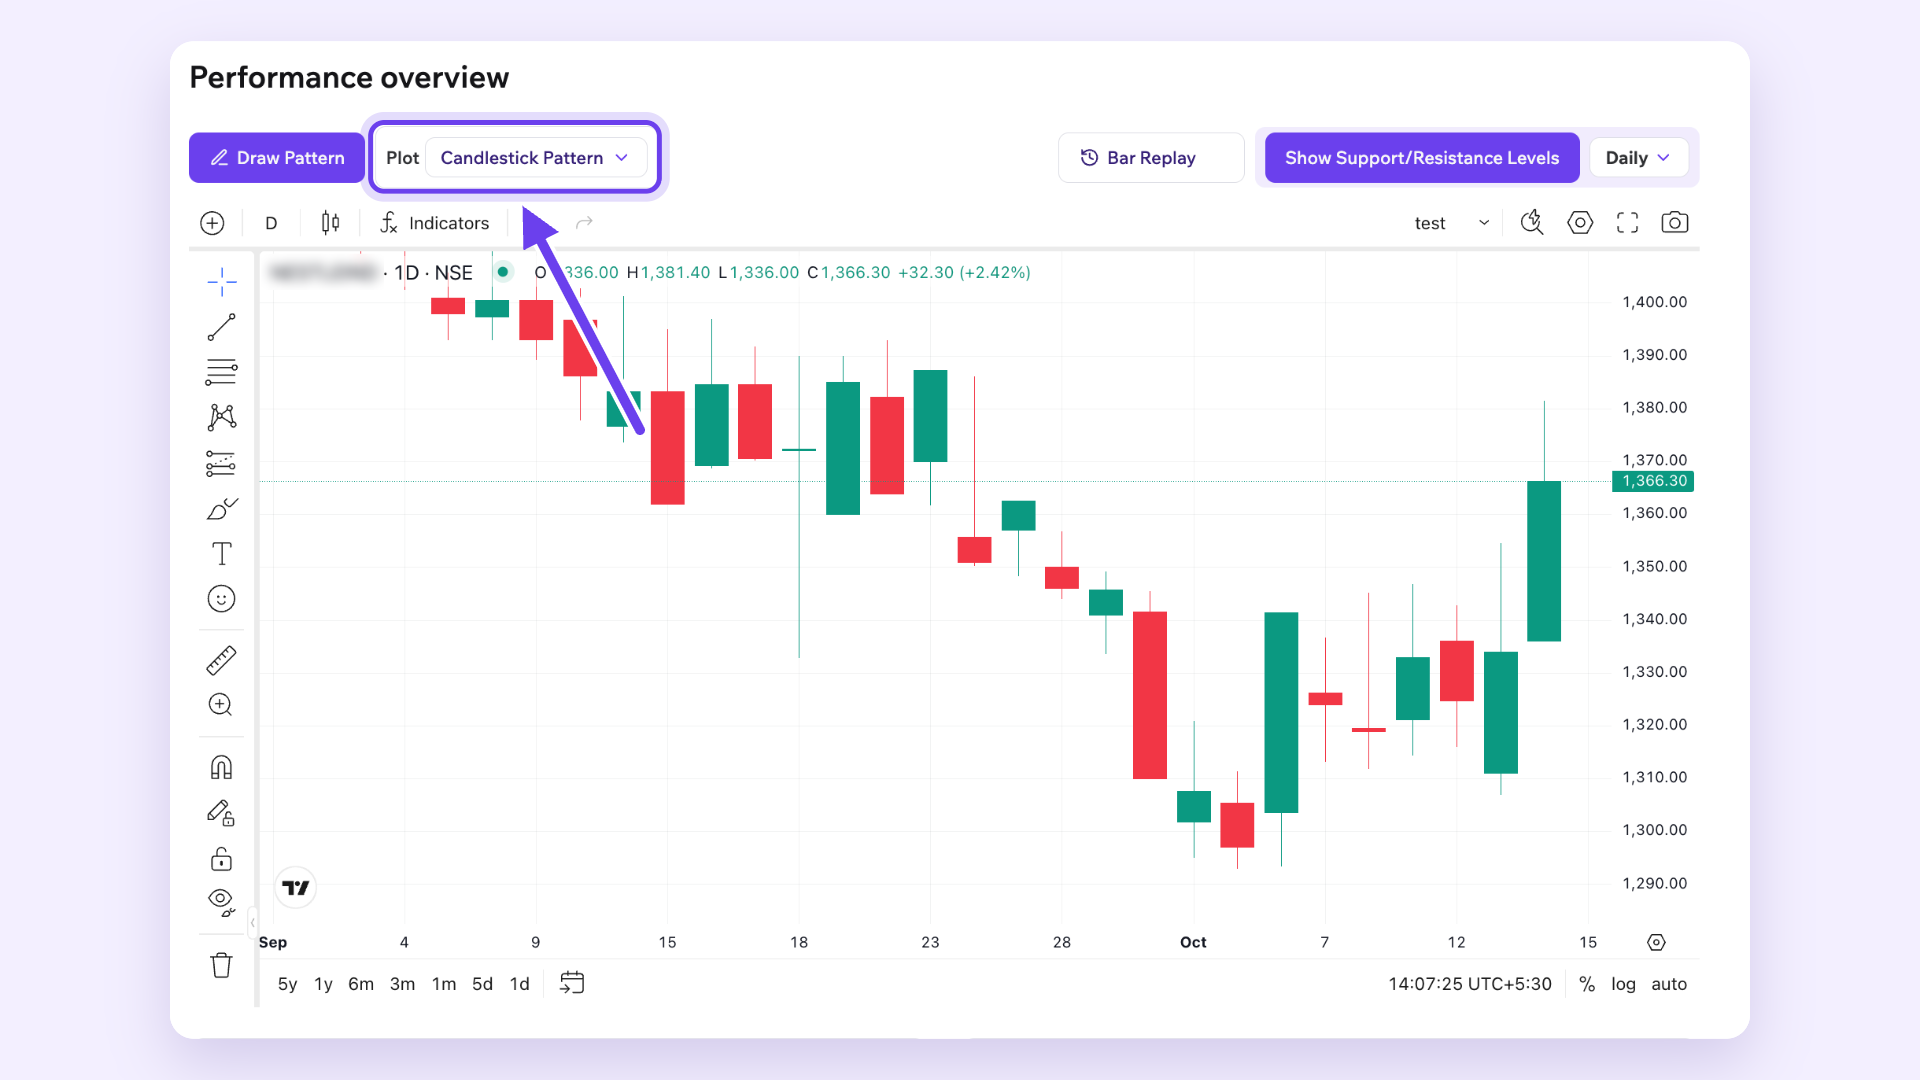
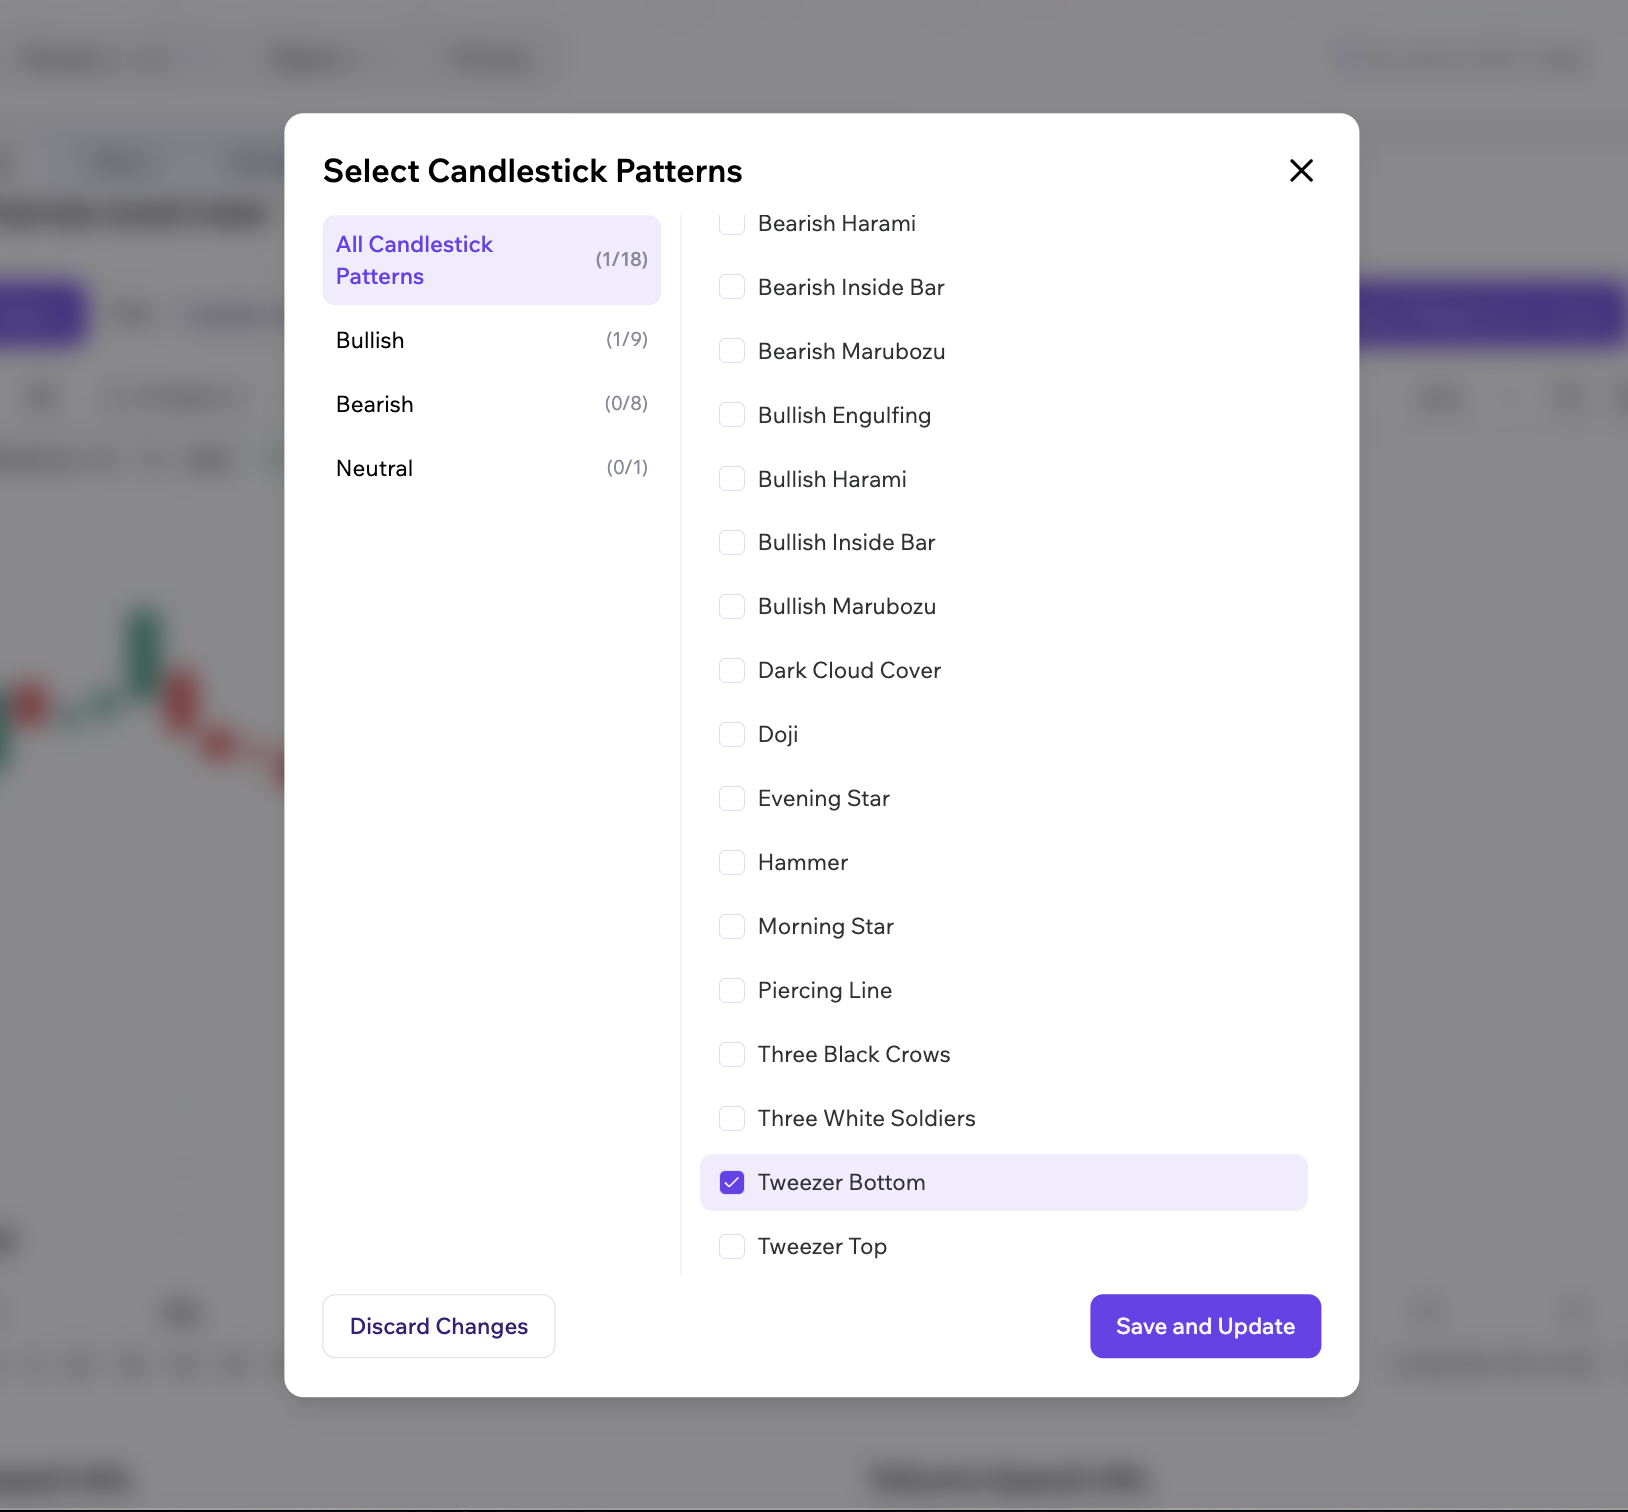
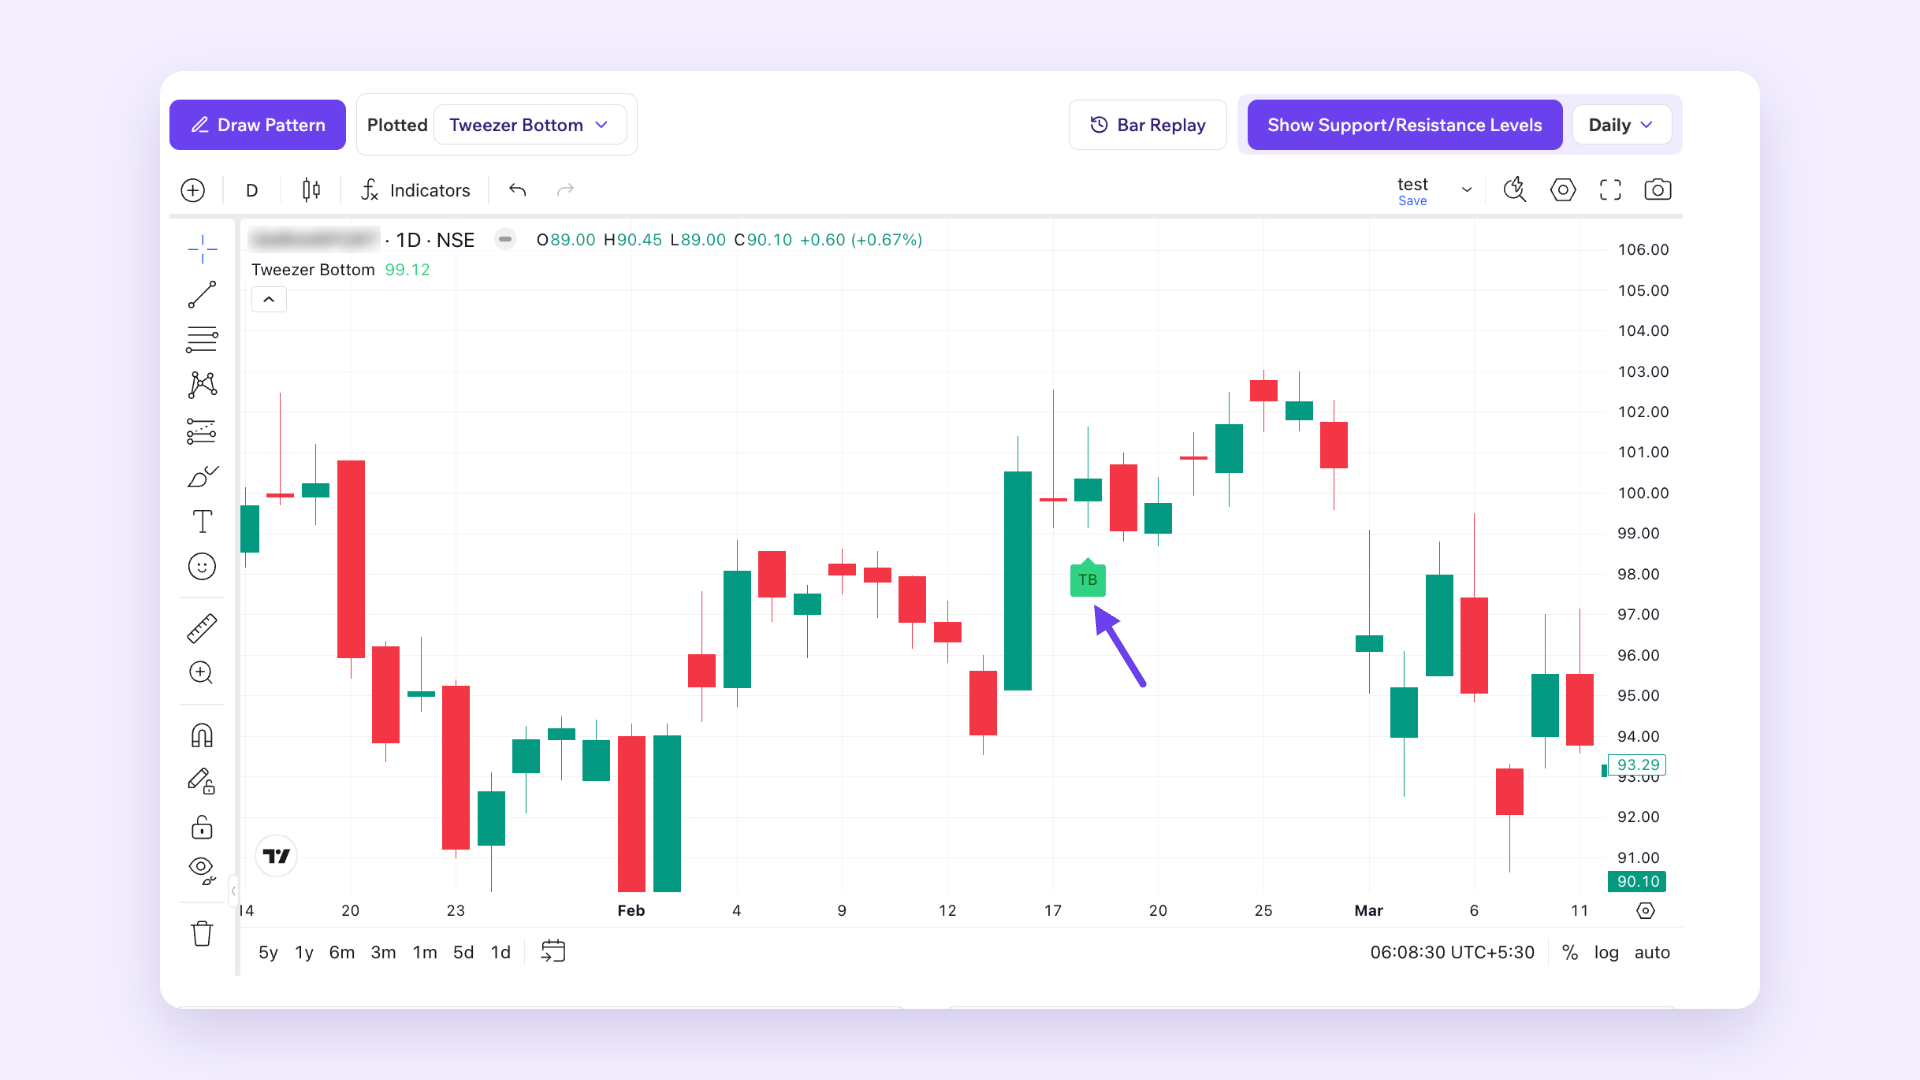
- Plot the pattern: The Plot dropdown has a Candlestick Pattern option. It opens a window listing 18 patterns, grouped as Bullish, Bearish, and Neutral. Tweezer Bottom is in the Bullish group. Select it and click Save and Update.
- Auto-detected patterns: Patterns found on the chart appear as tags above/below it.
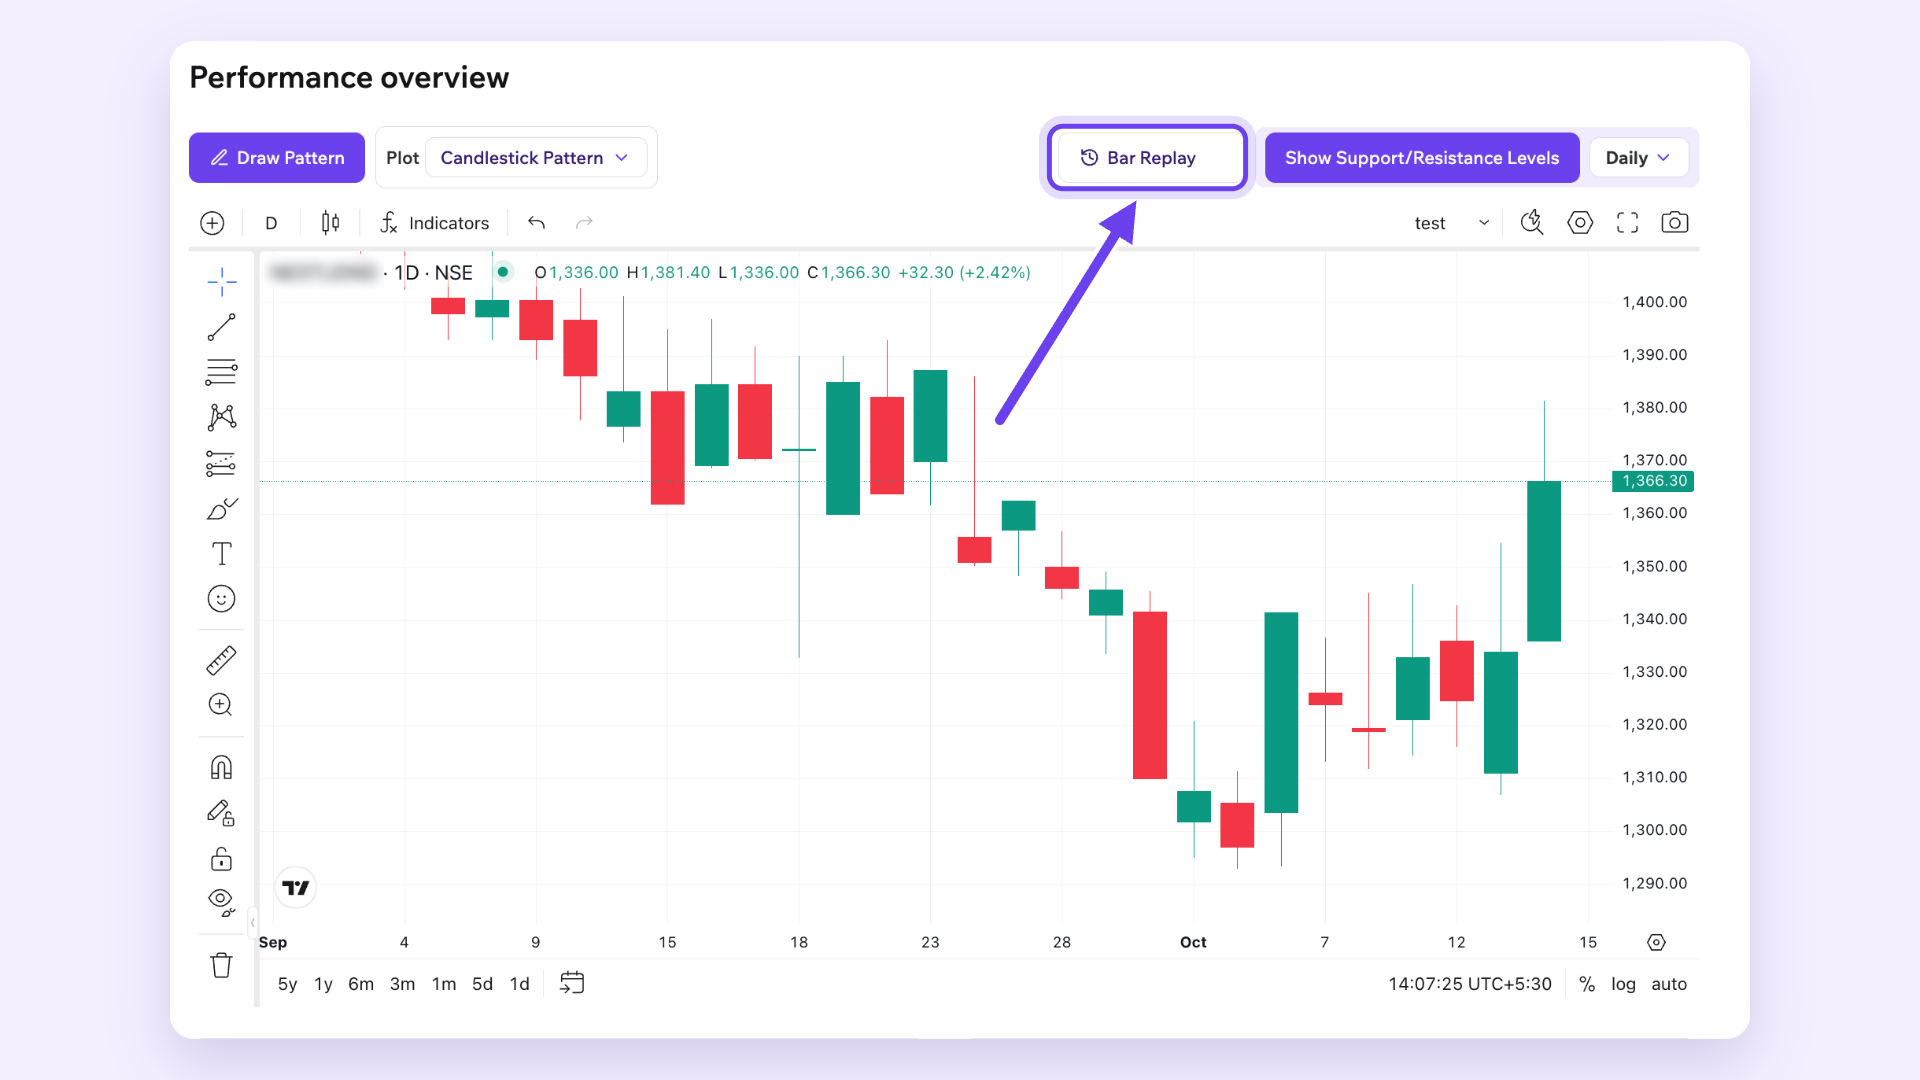
- Bar Replay: Replays the chart candle by candle, which makes it easier to see how the two candles of the pattern formed.
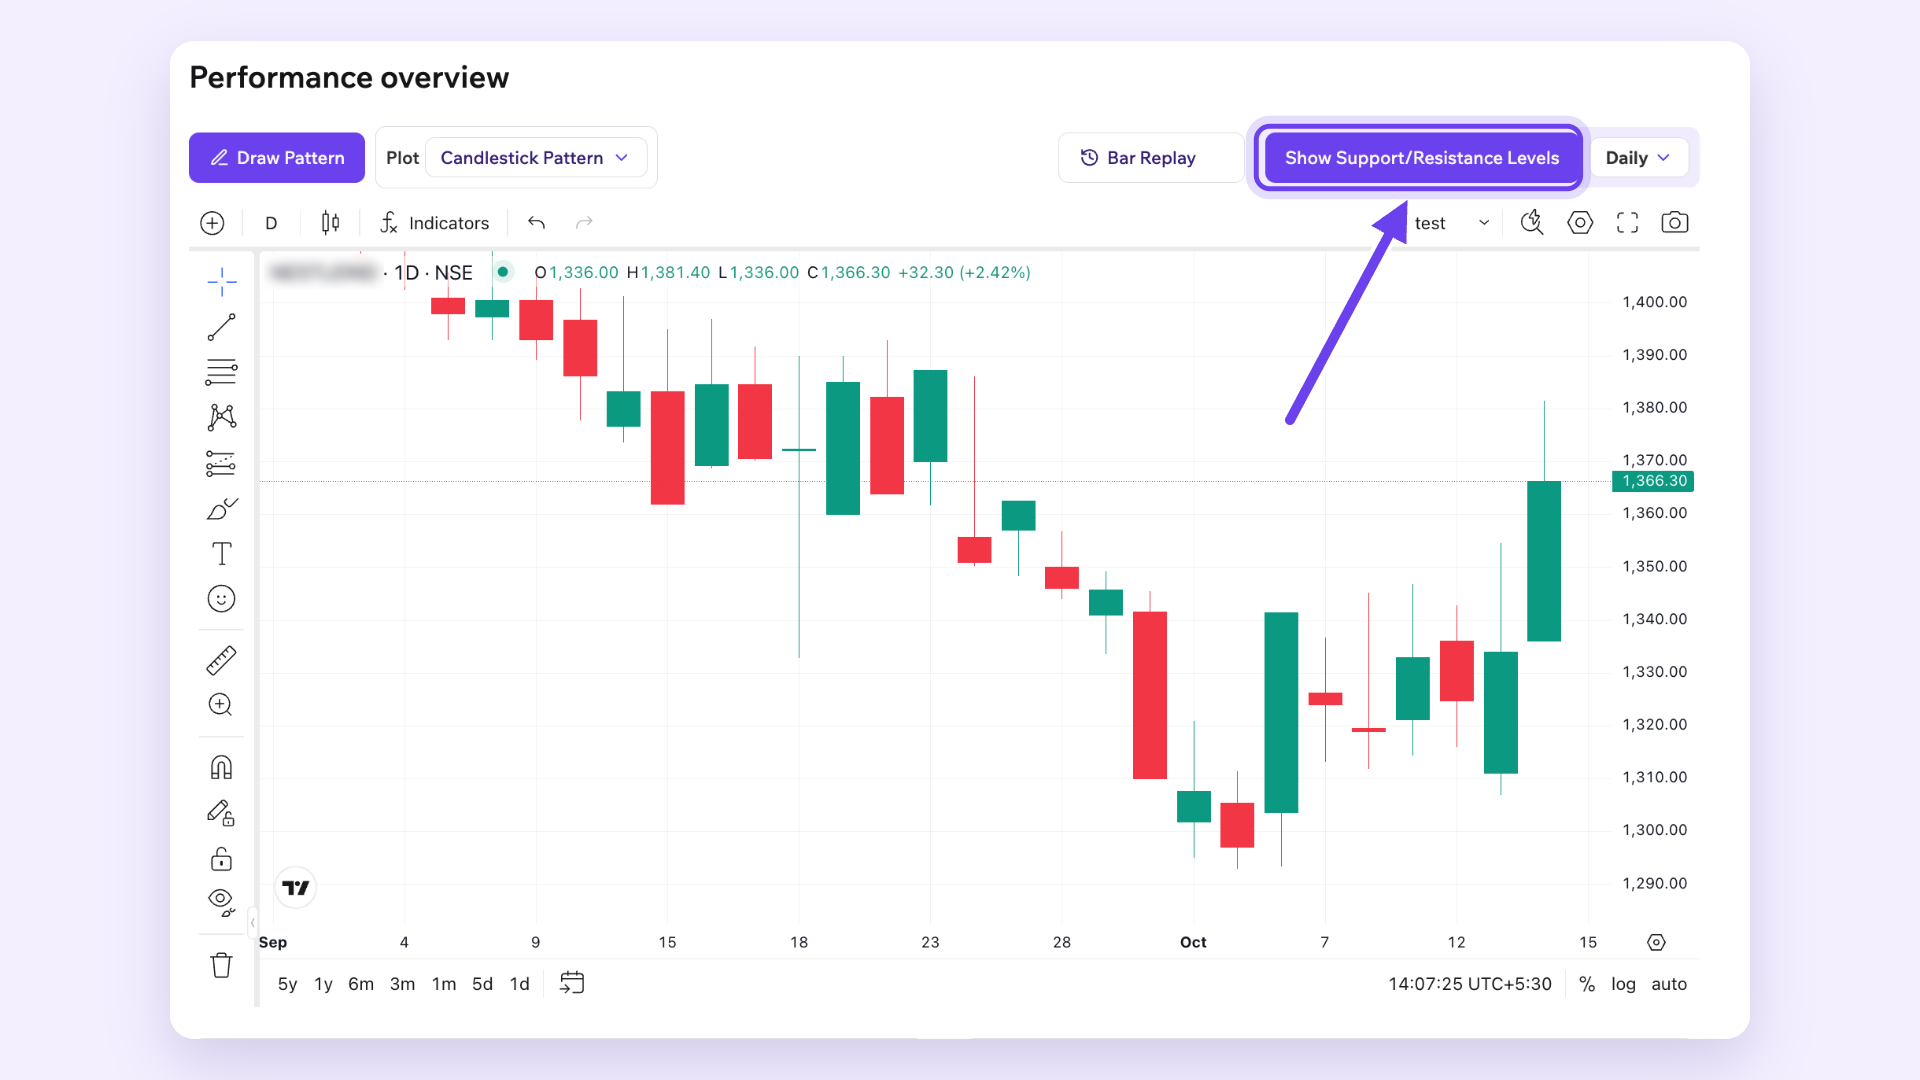
- Support/Resistance levels: The Show Support/Resistance Levels button overlays key levels on the chart, so you can see whether the pattern formed near resistance.
Final Thoughts
The tweezer bottom is a two-candle pattern that forms after a downtrend, where both candles reach the same or nearly the same low. Traders commonly read it as a sign that sellers could not push below the same price twice, and buyers may be stepping in.
On its own, the pattern does not confirm a reversal. Traders usually look at where it forms, how volume changes across the two candles, and whether the next candle closes higher. On Tradomate, you can plot the pattern on the chart and view support and resistance levels alongside it to see this context.
DISCLAIMER: This article is for educational and informational purposes only. It does not constitute investment advice or a research report.