The MAMA/FAMA indicator is a technical analysis tool that helps traders study trend direction and changes in momentum. Unlike traditional moving averages that use a fixed smoothing period, MAMA adapts its responsiveness to changing market conditions. FAMA follows MAMA with a smoother response, allowing traders to compare the movement of the two lines.
In this guide, we’ll explain what MAMA/FAMA is, how it works, what its crossovers mean, and how Tradomate can help you explore MAMA/FAMA-based screening conditions.
What Is MAMA/FAMA?
MAMA/FAMA stands for MESA Adaptive Moving Average and Following Adaptive Moving Average. Developed by John Ehlers, it is a trend-following indicator that uses information about market cycles to adjust how quickly its moving averages respond to price changes.
The indicator consists of two lines:
- MAMA (MESA Adaptive Moving Average): The faster, adaptive line. It adjusts its responsiveness to changing market conditions.
- FAMA (Following Adaptive Moving Average): A smoother line derived from MAMA. It follows MAMA with a slower response.
Together, the two lines help traders observe trend direction and potential shifts in momentum.
How Does the MAMA/FAMA Indicator Work?
Traditional moving averages, such as the Simple Moving Average (SMA) and Exponential Moving Average (EMA), use a fixed period or smoothing approach. MAMA works differently: it uses information about the market’s cyclical behaviour to adjust its smoothing factor.
In simple terms, MAMA adapts how quickly it responds to price changes. FAMA uses half of MAMA’s smoothing factor, so it follows the faster line more smoothly and reacts with a delay.
In Tradomate’s implementation, the calculation uses the midpoint of each candle’s high and low prices, known as HL2:
HL2 = (High + Low) / 2
The indicator uses Hilbert transform-based cycle analysis to estimate changes in market phase and adjust MAMA’s responsiveness. These calculations happen automatically, so traders can focus on interpreting the plotted lines rather than calculating them manually.
MAMA/FAMA Indicator Settings
The main settings available in Tradomate are:
| Parameter | Description | Default |
|---|
| Fast Limit | Sets the upper limit for MAMA’s adaptive smoothing factor, allowing it to respond more quickly to price changes | 0.5 |
| Slow Limit | Sets the lower limit for MAMA’s adaptive smoothing factor, controlling its minimum responsiveness | 0.05 |
These settings define the range within which MAMA adjusts its responsiveness. FAMA is derived from MAMA using half of its smoothing factor, so it does not have separate Fast Limit and Slow Limit settings.
The default values provide a starting point for exploring how the two lines behave across different market conditions.
What Do MAMA/FAMA Crossovers Mean?
A crossover occurs when MAMA moves from one side of FAMA to the other. Traders often observe these crossovers to understand changes in the relationship between the faster and slower lines.
1. Bullish MAMA/FAMA Crossover
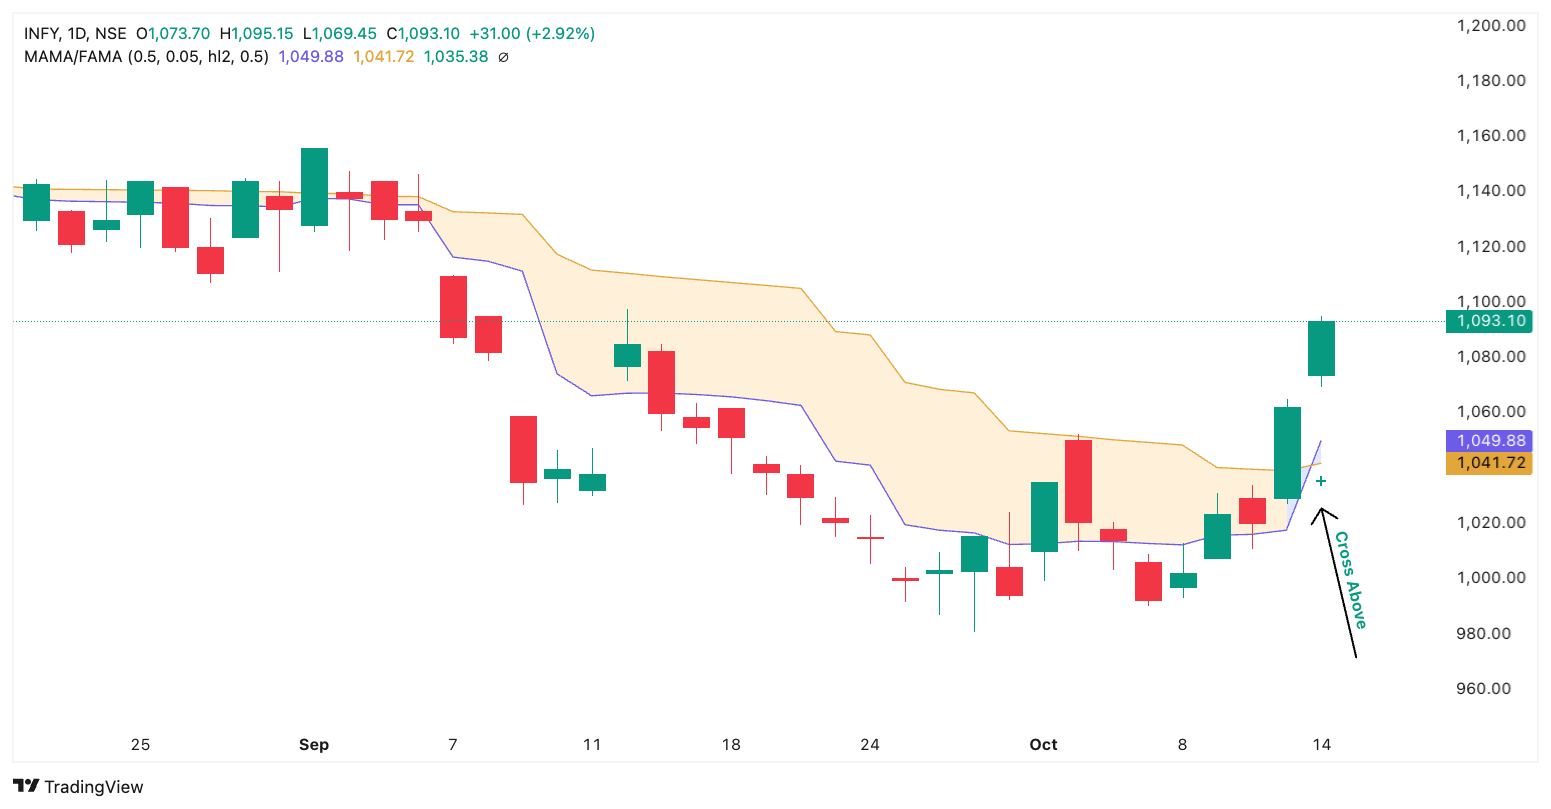
A bullish crossover occurs when MAMA crosses above FAMA. This can indicate that upward momentum is strengthening relative to the smoother average.
Traders may interpret this as a potential bullish signal. The surrounding price action and broader market conditions provide additional context for understanding the crossover.
2. Bearish MAMA/FAMA Crossover
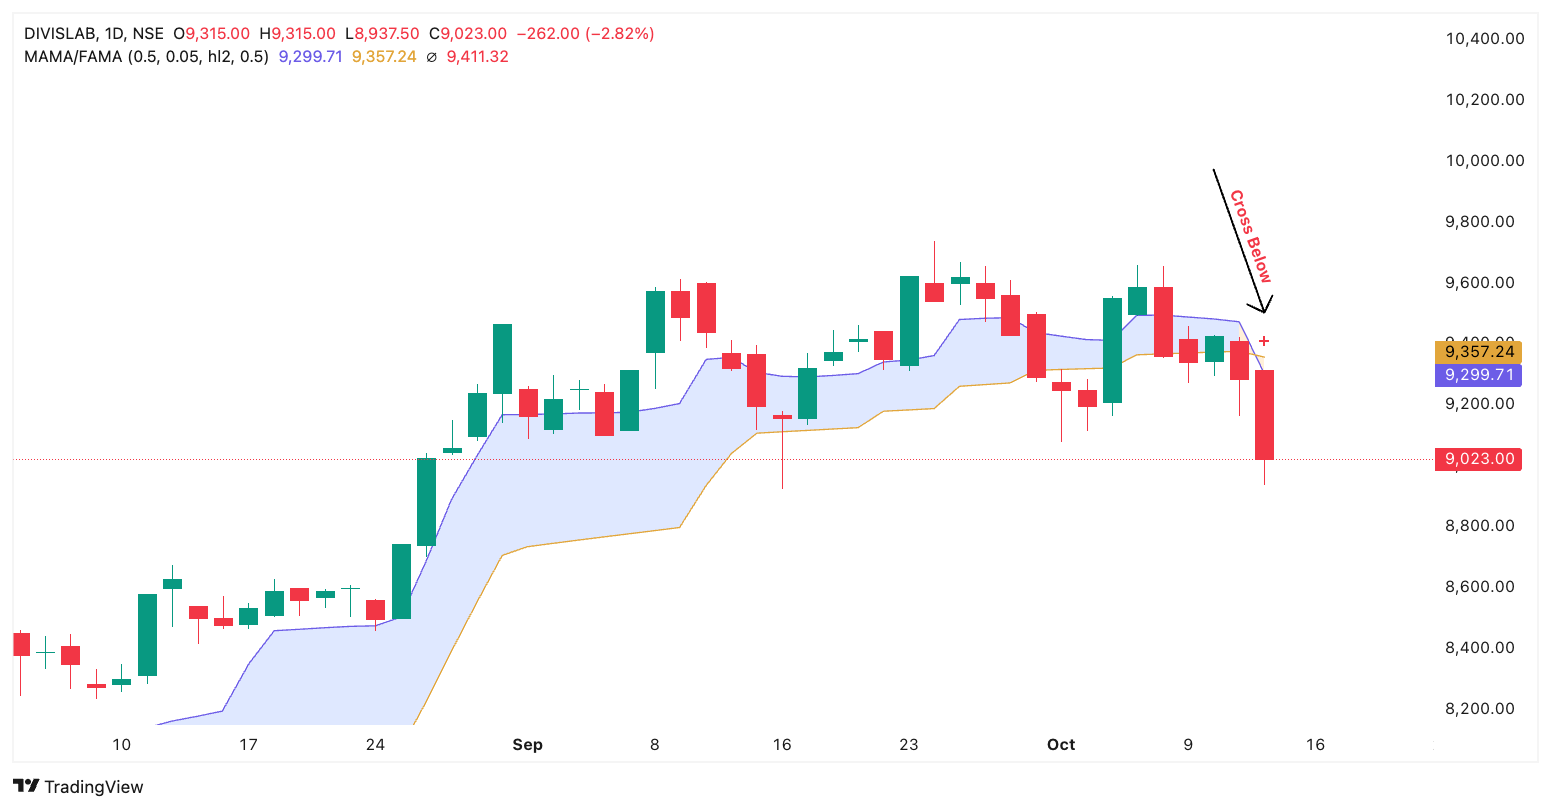
A bearish crossover occurs when MAMA crosses below FAMA. This can indicate that downward momentum is strengthening relative to the smoother average.
Traders may interpret this as a potential bearish signal, while also considering the stock’s price movement and broader trend.
3. Price Above or Below MAMA/FAMA
The relationship between price and the two lines provides another way to interpret the indicator:
- Price above both MAMA and FAMA: Price is trading above both adaptive averages.
- Price below both MAMA and FAMA: Price is trading below both adaptive averages.
- Price crossing above or below either line: Price has moved across an adaptive average, indicating a change in its relationship with that line.
These observations describe price behaviour relative to the indicator; they do not guarantee that a trend will continue or reverse.
How to Use MAMA/FAMA in Trading
MAMA/FAMA can be analysed alongside price action and other technical indicators. The following steps describe common ways traders interpret its signals.
Step 1: Identify the Crossover
Look for the two main signals:
- Bullish crossover: MAMA crosses above FAMA, which can indicate a potential shift towards positive momentum.
- Bearish crossover: MAMA crosses below FAMA, which can indicate a potential shift towards negative momentum.
Crossovers can also occur during sideways markets, so their significance depends on the surrounding price action and market conditions.
Step 2: Compare Price With Both Lines
Check where the stock is trading relative to MAMA and FAMA.
- Price above both lines: Price is trading above both adaptive averages.
- Price below both lines: Price is trading below both adaptive averages.
For example, a bullish crossover accompanied by price trading above both lines presents a different picture from a bullish crossover where price remains below them.
Step 3: Combine MAMA/FAMA With Other Indicators
MAMA/FAMA can be studied alongside other technical indicators to add context to a setup.
- EMA: The relationship between the 20-day and 50-day EMAs can provide additional information about the broader trend.
- RSI: The Relative Strength Index can help assess momentum alongside a MAMA/FAMA crossover.
- Volume: Comparing current volume with its recent average can show whether trading activity is elevated around a crossover.
Combining indicators does not eliminate false signals. Their usefulness depends on the conditions being analysed and how they perform in testing.
How Tradomate Helps You Screen MAMA/FAMA Setups
Tradomate lets you explore stocks using technical conditions, including MAMA/FAMA crossovers and their relationship with price and other indicators.
1. AI-Powered Screener
Tradomate’s AI-powered screener lets you describe a screening condition in plain language. For example, you can enter:
- “Stocks where MAMA crosses above FAMA”
- “Stocks trading above both MAMA and FAMA”
- “MAMA crossing below FAMA with price below the 20-day EMA”
The AI Screener translates supported requests into screening conditions, helping you explore setups without manually building every expression.
2. Screener Backtesting
You can backtest a MAMA/FAMA-based screen against historical data to examine how often the conditions appeared and how the resulting setups performed over the selected period.
Backtesting provides historical context for evaluating a screening idea. Past performance does not guarantee future results, and the results depend on the conditions and settings used.
3. Combine Multiple Technical Conditions
You can combine MAMA/FAMA conditions with other supported technical indicators and price filters to create more specific screens.
For example, a screen can look for a bullish MAMA/FAMA crossover alongside price trading above the 20-day EMA. This lets you examine the crossover in the context of another trend condition.
MAMA/FAMA vs EMA: What’s the Difference?
MAMA/FAMA and EMA are both used to study price trends, but they differ in how they calculate their averages.
| Feature | MAMA/FAMA | EMA |
|---|
| Calculation | Adapts smoothing using market cycle information | Uses a fixed smoothing period |
| Responsiveness | MAMA adjusts its responsiveness to changing conditions | Responsiveness depends on the selected period |
| Structure | Two related lines: MAMA and FAMA | One line for each selected EMA period |
| Common use | Studying adaptive trend changes and crossovers | Studying price trends and the relationship between different averages |
| Limitation | Can produce false signals in choppy markets | Can lag behind rapid price changes |
Neither indicator is universally better. MAMA/FAMA offers adaptive smoothing, while EMA provides a more straightforward, fixed-period approach to analysing price trends.
Common Mistakes to Avoid When Using MAMA/FAMA
MAMA/FAMA can produce misleading signals in certain market conditions. Here are a few things to keep in mind:
- Relying Only on Crossovers: A crossover does not guarantee that price will continue in the same direction. Consider the broader market context.
- Ignoring Sideways Markets: Repeated crossovers can occur when price moves within a narrow range, producing signals without a sustained trend.
- Changing Settings Without Testing: Different Fast Limit and Slow Limit values can change the indicator’s behaviour. Evaluate parameter changes systematically rather than selecting settings based on a few examples.
- Treating Backtest Results as Guarantees: Historical results describe past behaviour and may not reflect future market conditions.
- Overlooking Risk Management: Technical indicators describe market behaviour; they do not remove trading risk. Any trading approach involves uncertainty and should be evaluated with appropriate risk controls.
Final Thoughts
MAMA/FAMA is an adaptive moving average indicator that helps traders study trends and changes in momentum. MAMA adjusts its responsiveness to changing market conditions, while FAMA follows it with a smoother response. Their crossovers and relationship with price offer different ways to analyse market behaviour.
Rather than interpreting a crossover in isolation, it helps to understand the surrounding price action and the conditions under which the signal appears. Historical testing can also provide context for evaluating different screening approaches.
With Tradomate, you can screen for MAMA/FAMA conditions, combine them with other technical indicators, and backtest screening ideas to examine their historical behaviour.
Explore Tradomate’s expert trading blog section to learn more about technical indicators and screening concepts.
DISCLAIMER: This article is for educational and informational purposes only. It does not constitute investment advice or a research report.
DISCLAIMER: This article is for educational and informational purposes only. It does not constitute investment advice or a research report.